What Does Beta Mean in Stocks, and How May It Be Used in Risk Management?
Beta is a key measure of how a stock moves relative to the market, helping traders assess risk exposure and price volatility. Understanding this indicator can help traders analyse potential price swings and portfolio stability. This article explores how beta works, its implications, and how it may be used in risk analysis.
What Is Beta in Stocks and How Does It Affect Risk?
Beta is a statistical measure that quantifies how a stock’s price fluctuates relative to the broader market. It helps traders analyse systematic risk—the kind that affects most stocks at the same time, such as economic downturns or interest rate changes. The number itself comes from regression analysis, which compares a stock’s potential returns to a benchmark index like the FTSE 100 or S&P 500.
A beta of 1.0 indicates that a share generally tracks the movements of its benchmark index. If the index gains 5%, a stock with a value of 1.0 is likely to rise by about the same amount. A beta above 1 signals greater volatility—company shares with a beta of 1.8 may rise 9% when the market gains 5%, but they also tend to fall more sharply during downturns. A value below 1 suggests lower volatility, with the asset moving less than the broader index.
Interpreting Beta Values
Now, we will examine beta values in detail.
High Beta Stocks (>1.0)
These stocks react strongly to market changes. High beta is common in technology, consumer discretionary, and financials, where investor sentiment drives price movements. While they offer the potential for higher returns, they also come with increased price swings.
Low Beta Stocks (<1.0 but >0)
Lower beta stocks experience smaller movements compared to an index. A value of 0.6, for example, suggests it might rise 3% if the market gains 5%. Sectors like utilities, healthcare, and consumer staples often have these types of stocks, as demand for their products tends to remain stable, except in situations such as the COVID-19 pandemic.
Negative Beta Stocks (<0)
Some assets, such as gold mining company shares, have negative beta values, meaning they move in the opposite direction of the broader market. These assets can act as a hedge when markets decline, though a negative value is relatively rare.
While the beta of a stock provides insights into its volatility, it doesn’t account for company-specific risks or broader economic shifts. Investors often combine this form of analysis with fundamental and technical factors to build a more complete view of exposure.
How Traders Use Beta in Measuring Risk
Rather than examining price movements in isolation, traders use beta to evaluate how a stock reacts to broader trends. This helps them decide whether it aligns with their risk tolerance and market outlook.
Analysing Systematic Risk
Since beta measures sensitivity to the market, it’s useful for assessing systematic risk—the kind of risk that can’t be eliminated through diversification. A stock with a high beta will likely experience sharp swings during broader turbulence, making it appealing for those looking to capitalise on potential momentum but at the cost of greater volatility. In contrast, low-beta shares may hold up better in downturns but won’t rally as aggressively in bull markets.
Beta in Portfolio Construction
Investors often consider this metric when balancing a portfolio’s overall risk level. A portfolio heavily weighted in high-beta company shares can be more volatile, while one with low-beta stocks may offer less volatile potential returns. Some investors focus on diversified beta investing, combining high- and low-beta assets to adjust their exposure depending on overall conditions.
The Capital Asset Pricing Model (CAPM)
Beta is also a key component of the Capital Asset Pricing Model (CAPM), which estimates a stock’s expected return based on its risk level. CAPM considers the relationship between beta and market returns, helping to compare potential opportunities. If the asset is more volatile than an index but offers lower-than-expected rewards, it may not justify the added volatility.
The Limitations of Beta
Beta is a useful tool for assessing how a stock moves relative to an index, but it has shortcomings. Since it’s based on historical price data, it doesn’t always reflect how the asset will behave in the future. It’s important to be aware of its limitations when using it for risk assessment.
1. It Changes Over Time
Beta in a stock is not a fixed number. Company risk profiles can shift due to short-term developments, industry changes, or economic cycles, and impact a stock’s beta, meaning a stock with a value of 1.5 today might move closer to 1.0 over time as conditions evolve.
2. It Doesn’t Account for Company-Specific Risk
Beta measures systematic risk, meaning it doesn’t factor in aspects specific to a company, such as management changes, earnings surprises, or regulatory issues. Two stocks can have the same beta but react very differently to news.
3. High Beta Doesn’t Always Mean Greater Potential Returns
A stock with a beta of 2.0 might move twice as much as the market, but that doesn’t mean it will generate higher potential returns. If the asset consistently underperforms, its added volatility becomes a liability rather than an advantage.
4. Different Market Conditions Affect Reliability
Beta tends to be more stable in normal market conditions but can break down during extreme events, such as financial crises or sudden liquidity shocks. In times of panic, correlations between assets often increase, making the metric less useful for risk analysis.
Practical Examples of Beta in Action
Looking at beta in real-world scenarios helps illustrate how different stocks react. Two well-known examples are NVIDIA (NVDA) and Johnson & Johnson (JNJ), which have very different values.
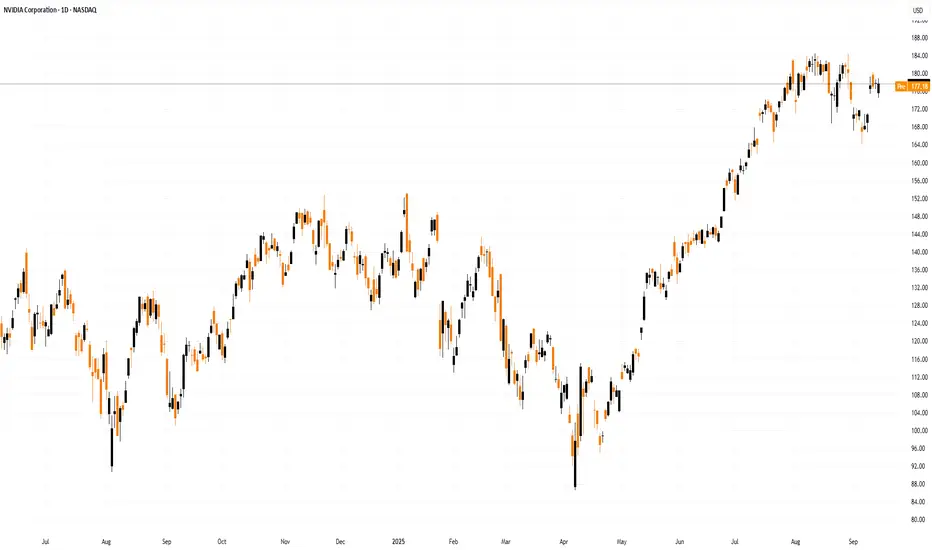
NVIDIA (NVDA) – 1.76
According to Yahoo Finance, NVIDIA has a 5-year monthly beta of 1.76. This means its price is about 76% more volatile than the S&P 500. If the index gains 10%, NVIDIA’s stock could rise around 17.6%. However, in a downturn, it could fall by a similar magnitude. The tech sector is highly sensitive to market sentiment, innovation cycles, and economic conditions, making high-beta assets like NVIDIA riskier but also capable of higher potential returns.
Johnson & Johnson (JNJ) – 0.46
Johnson & Johnson has a 5-year monthly beta of 0.46 (source: Yahoo Finance), meaning it moves about 54% less than the market. If the index rises or falls 10%, JNJ stock might move by 4.6%. The lower value reflects the so-called stability of the healthcare industry, where consistent demand for products like medical devices and pharmaceuticals tends to lead to more resilient stock performance.
Key Takeaways
Those willing to take on more risk for higher potential returns often favour high-beta stocks like NVIDIA, while those seeking less volatility may prefer low-beta companies such as Johnson & Johnson. However, the measure ignores company-specific risks or specific short-term outperformance factors (e.g. positive earnings or product releases), and it is typically calculated over a long timeframe—5 years in this instance.
The Bottom Line
Understanding the beta definition and how it applies may help traders and investors assess a stock’s volatility. Whether they are focused on high-beta growth stocks or lower-volatility options, this metric may help traders refine their strategy. However, while it may provide useful insights, it should be used alongside other analysis methods for a well-rounded approach.
FAQ
What Does Beta Mean in Stocks?
The beta in stocks meaning refers to a measure of how much a stock moves relative to the broader market. A beta of 1.0 means it generally follows market movements, while a beta above or below 1 indicates higher or lower volatility, respectively.
What Are High Beta Stocks?
High-beta stocks have a beta greater than 1, meaning they tend to move more than the overall market. These assets often belong to technology, consumer discretionary, and financials, where price swings are more pronounced.
What Does a Portfolio Beta Measure?
Portfolio beta calculates the overall volatility of a portfolio relative to an index. It’s determined by weighting each stock’s beta based on its proportion in the portfolio. A portfolio with a value above 1 is more volatile than the market, while one below 1 is less volatile.
What Does a Stock With a Beta of 1.5 Indicate?
A stock with a beta of 1.5 is 50% more volatile than the market. If the index rises 5%, shares might increase by 7.5%, but it could also fall more sharply in downturns.
What Is β?
The symbol β is a Greek letter signifying beta. The beta meaning in finance refers to a stock’s expected performance relative to an index.
This article represents the opinion of the Companies operating under the FXOpen brand only. It is not to be construed as an offer, solicitation, or recommendation with respect to products and services provided by the Companies operating under the FXOpen brand, nor is it to be considered financial advice.
Beta is a key measure of how a stock moves relative to the market, helping traders assess risk exposure and price volatility. Understanding this indicator can help traders analyse potential price swings and portfolio stability. This article explores how beta works, its implications, and how it may be used in risk analysis.
What Is Beta in Stocks and How Does It Affect Risk?
Beta is a statistical measure that quantifies how a stock’s price fluctuates relative to the broader market. It helps traders analyse systematic risk—the kind that affects most stocks at the same time, such as economic downturns or interest rate changes. The number itself comes from regression analysis, which compares a stock’s potential returns to a benchmark index like the FTSE 100 or S&P 500.
A beta of 1.0 indicates that a share generally tracks the movements of its benchmark index. If the index gains 5%, a stock with a value of 1.0 is likely to rise by about the same amount. A beta above 1 signals greater volatility—company shares with a beta of 1.8 may rise 9% when the market gains 5%, but they also tend to fall more sharply during downturns. A value below 1 suggests lower volatility, with the asset moving less than the broader index.
Interpreting Beta Values
Now, we will examine beta values in detail.
High Beta Stocks (>1.0)
These stocks react strongly to market changes. High beta is common in technology, consumer discretionary, and financials, where investor sentiment drives price movements. While they offer the potential for higher returns, they also come with increased price swings.
Low Beta Stocks (<1.0 but >0)
Lower beta stocks experience smaller movements compared to an index. A value of 0.6, for example, suggests it might rise 3% if the market gains 5%. Sectors like utilities, healthcare, and consumer staples often have these types of stocks, as demand for their products tends to remain stable, except in situations such as the COVID-19 pandemic.
Negative Beta Stocks (<0)
Some assets, such as gold mining company shares, have negative beta values, meaning they move in the opposite direction of the broader market. These assets can act as a hedge when markets decline, though a negative value is relatively rare.
While the beta of a stock provides insights into its volatility, it doesn’t account for company-specific risks or broader economic shifts. Investors often combine this form of analysis with fundamental and technical factors to build a more complete view of exposure.
How Traders Use Beta in Measuring Risk
Rather than examining price movements in isolation, traders use beta to evaluate how a stock reacts to broader trends. This helps them decide whether it aligns with their risk tolerance and market outlook.
Analysing Systematic Risk
Since beta measures sensitivity to the market, it’s useful for assessing systematic risk—the kind of risk that can’t be eliminated through diversification. A stock with a high beta will likely experience sharp swings during broader turbulence, making it appealing for those looking to capitalise on potential momentum but at the cost of greater volatility. In contrast, low-beta shares may hold up better in downturns but won’t rally as aggressively in bull markets.
Beta in Portfolio Construction
Investors often consider this metric when balancing a portfolio’s overall risk level. A portfolio heavily weighted in high-beta company shares can be more volatile, while one with low-beta stocks may offer less volatile potential returns. Some investors focus on diversified beta investing, combining high- and low-beta assets to adjust their exposure depending on overall conditions.
The Capital Asset Pricing Model (CAPM)
Beta is also a key component of the Capital Asset Pricing Model (CAPM), which estimates a stock’s expected return based on its risk level. CAPM considers the relationship between beta and market returns, helping to compare potential opportunities. If the asset is more volatile than an index but offers lower-than-expected rewards, it may not justify the added volatility.
The Limitations of Beta
Beta is a useful tool for assessing how a stock moves relative to an index, but it has shortcomings. Since it’s based on historical price data, it doesn’t always reflect how the asset will behave in the future. It’s important to be aware of its limitations when using it for risk assessment.
1. It Changes Over Time
Beta in a stock is not a fixed number. Company risk profiles can shift due to short-term developments, industry changes, or economic cycles, and impact a stock’s beta, meaning a stock with a value of 1.5 today might move closer to 1.0 over time as conditions evolve.
2. It Doesn’t Account for Company-Specific Risk
Beta measures systematic risk, meaning it doesn’t factor in aspects specific to a company, such as management changes, earnings surprises, or regulatory issues. Two stocks can have the same beta but react very differently to news.
3. High Beta Doesn’t Always Mean Greater Potential Returns
A stock with a beta of 2.0 might move twice as much as the market, but that doesn’t mean it will generate higher potential returns. If the asset consistently underperforms, its added volatility becomes a liability rather than an advantage.
4. Different Market Conditions Affect Reliability
Beta tends to be more stable in normal market conditions but can break down during extreme events, such as financial crises or sudden liquidity shocks. In times of panic, correlations between assets often increase, making the metric less useful for risk analysis.
Practical Examples of Beta in Action
Looking at beta in real-world scenarios helps illustrate how different stocks react. Two well-known examples are NVIDIA (NVDA) and Johnson & Johnson (JNJ), which have very different values.
NVIDIA (NVDA) – 1.76
According to Yahoo Finance, NVIDIA has a 5-year monthly beta of 1.76. This means its price is about 76% more volatile than the S&P 500. If the index gains 10%, NVIDIA’s stock could rise around 17.6%. However, in a downturn, it could fall by a similar magnitude. The tech sector is highly sensitive to market sentiment, innovation cycles, and economic conditions, making high-beta assets like NVIDIA riskier but also capable of higher potential returns.
Johnson & Johnson (JNJ) – 0.46
Johnson & Johnson has a 5-year monthly beta of 0.46 (source: Yahoo Finance), meaning it moves about 54% less than the market. If the index rises or falls 10%, JNJ stock might move by 4.6%. The lower value reflects the so-called stability of the healthcare industry, where consistent demand for products like medical devices and pharmaceuticals tends to lead to more resilient stock performance.
Key Takeaways
Those willing to take on more risk for higher potential returns often favour high-beta stocks like NVIDIA, while those seeking less volatility may prefer low-beta companies such as Johnson & Johnson. However, the measure ignores company-specific risks or specific short-term outperformance factors (e.g. positive earnings or product releases), and it is typically calculated over a long timeframe—5 years in this instance.
The Bottom Line
Understanding the beta definition and how it applies may help traders and investors assess a stock’s volatility. Whether they are focused on high-beta growth stocks or lower-volatility options, this metric may help traders refine their strategy. However, while it may provide useful insights, it should be used alongside other analysis methods for a well-rounded approach.
FAQ
What Does Beta Mean in Stocks?
The beta in stocks meaning refers to a measure of how much a stock moves relative to the broader market. A beta of 1.0 means it generally follows market movements, while a beta above or below 1 indicates higher or lower volatility, respectively.
What Are High Beta Stocks?
High-beta stocks have a beta greater than 1, meaning they tend to move more than the overall market. These assets often belong to technology, consumer discretionary, and financials, where price swings are more pronounced.
What Does a Portfolio Beta Measure?
Portfolio beta calculates the overall volatility of a portfolio relative to an index. It’s determined by weighting each stock’s beta based on its proportion in the portfolio. A portfolio with a value above 1 is more volatile than the market, while one below 1 is less volatile.
What Does a Stock With a Beta of 1.5 Indicate?
A stock with a beta of 1.5 is 50% more volatile than the market. If the index rises 5%, shares might increase by 7.5%, but it could also fall more sharply in downturns.
What Is β?
The symbol β is a Greek letter signifying beta. The beta meaning in finance refers to a stock’s expected performance relative to an index.
This article represents the opinion of the Companies operating under the FXOpen brand only. It is not to be construed as an offer, solicitation, or recommendation with respect to products and services provided by the Companies operating under the FXOpen brand, nor is it to be considered financial advice.
免責事項
この情報および投稿は、TradingViewが提供または推奨する金融、投資、トレード、その他のアドバイスや推奨を意図するものではなく、それらを構成するものでもありません。詳細は利用規約をご覧ください。
免責事項
この情報および投稿は、TradingViewが提供または推奨する金融、投資、トレード、その他のアドバイスや推奨を意図するものではなく、それらを構成するものでもありません。詳細は利用規約をご覧ください。