Hi guys,
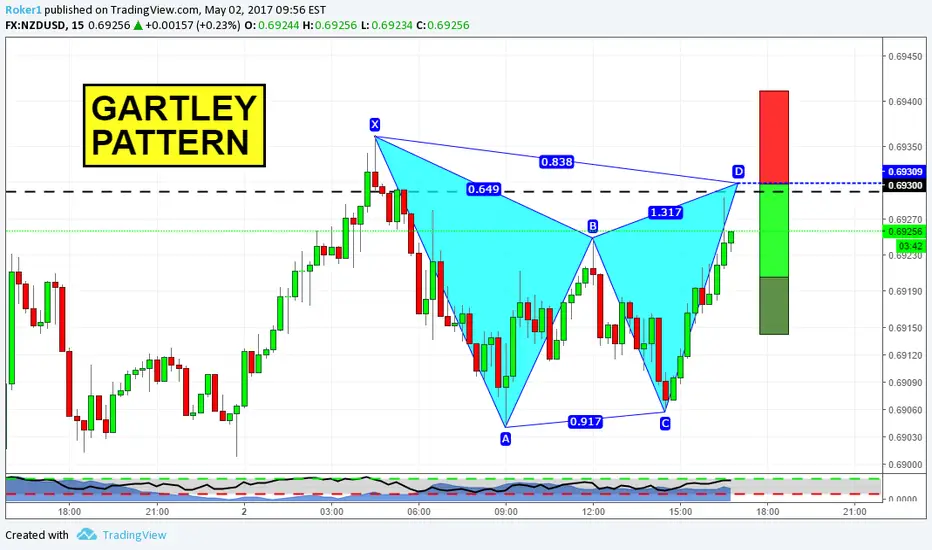
here on the chart you can see 15m timeframe on NZDUSD. This Gartley lines up pretty well with a former structure level that could act as resistance now. Therefore, the likelihood of this trade is increased by that. Stops above X, targets as usual for harmonics.
If you have questions, or if you want to share your view, feel free to comment below.
Otherwise, see you in the next chart!
トレード終了: ストップロスに到達
Small loss here免責事項
この情報および投稿は、TradingViewが提供または推奨する金融、投資、トレード、その他のアドバイスや推奨を意図するものではなく、それらを構成するものでもありません。詳細は利用規約をご覧ください。
免責事項
この情報および投稿は、TradingViewが提供または推奨する金融、投資、トレード、その他のアドバイスや推奨を意図するものではなく、それらを構成するものでもありません。詳細は利用規約をご覧ください。