Summary of ORCL's technical on its daily chart:
Its Resistances:
Its Supports
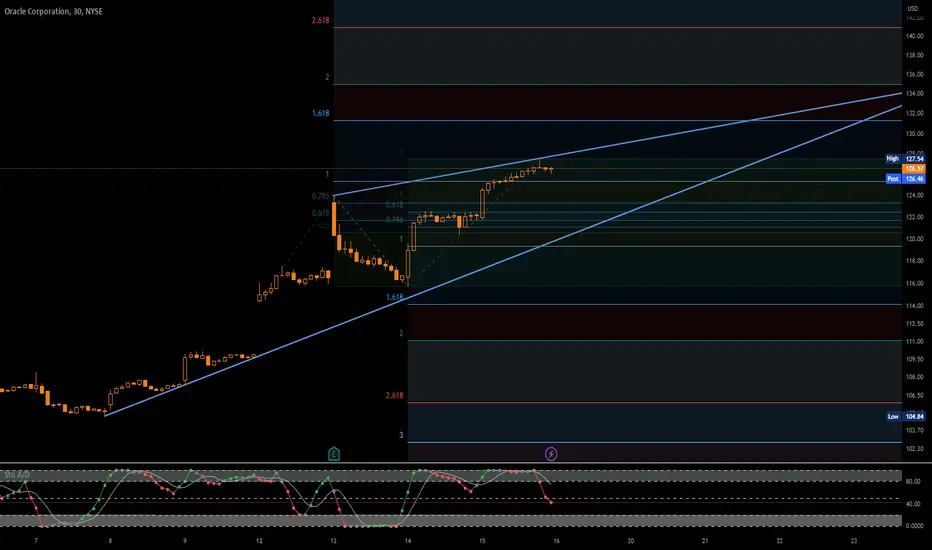
- The RSI is trading above 70. This could mean that either the stock is in a lasting uptrend or just overbought and that therefore a correction could shape (look for bearish divergence in this case). The MACD is above its signal line and positive. The configuration is positive. Moreover, the stock is above its 20 and 50 day moving average (respectively at 106.3455 and 99.8614). Finally, Oracle is trading above its upper Bollinger band (standing at 118.54).
Its Resistances:
- 141.4 **
- 137.6 *
- 133.8 **
- 130
Its Supports
- 113.4
- 111 **
- 105.1 *
- 101.5 **
関連の投稿
免責事項
これらの情報および投稿は、TradingViewが提供または保証する金融、投資、取引、またはその他の種類のアドバイスや推奨を意図したものではなく、またそのようなものでもありません。詳しくは利用規約をご覧ください。
免責事項
これらの情報および投稿は、TradingViewが提供または保証する金融、投資、取引、またはその他の種類のアドバイスや推奨を意図したものではなく、またそのようなものでもありません。詳しくは利用規約をご覧ください。