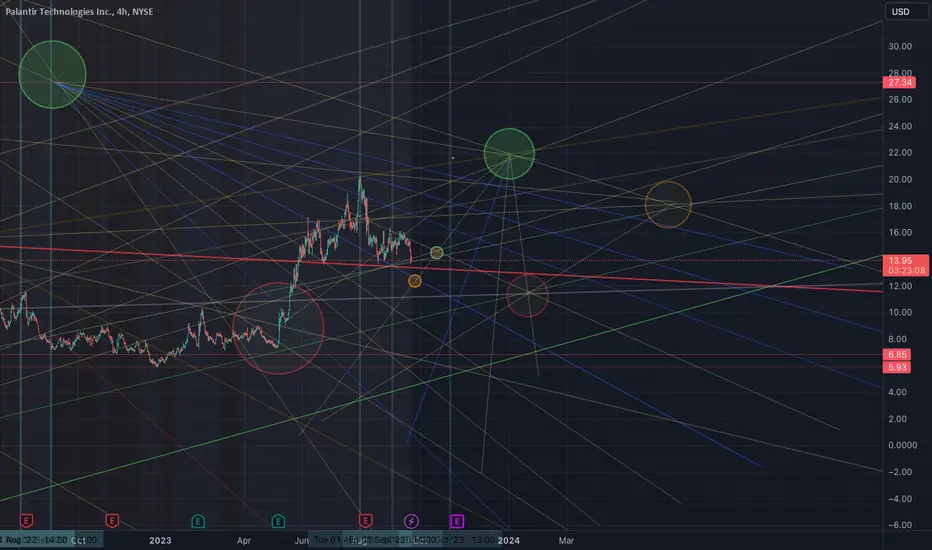
$PLTR Palentir - 4 hour - trend matrix development
A trend matrix, also known as a trend analysis matrix, is a tool used to analyze and visualize trends in data over time. It helps in identifying patterns, making forecasts, and making informed decisions based on historical data. Developing a trend matrix involves several steps:
A geometric trendline matrix is a visual representation of geometric trends in data over time. Geometric trends are characterized by a constant ratio of change rather than a constant amount of change, which is typical of linear trends.
The ratio degrades to a 0 point hub. Which often acts as a sort of cog to the movement of the dataflow.
This is a 4 hour chart of Palentir
免責事項
これらの情報および投稿は、TradingViewが提供または保証する金融、投資、取引、またはその他の種類のアドバイスや推奨を意図したものではなく、またそのようなものでもありません。詳しくは利用規約をご覧ください。
免責事項
これらの情報および投稿は、TradingViewが提供または保証する金融、投資、取引、またはその他の種類のアドバイスや推奨を意図したものではなく、またそのようなものでもありません。詳しくは利用規約をご覧ください。