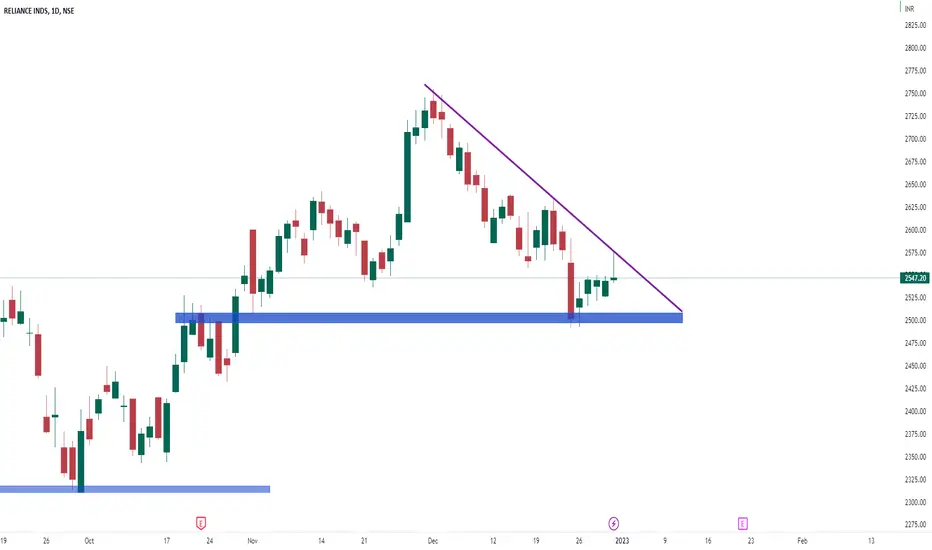
Day chart of reliance ind
it is making triangle pattern on daily chart in which important support zone is 2490 zone and Resistance is trendline
& today it is making inverse hammer candle which indicates bearish view for monday. On monday if this stocks breaks friday low then I will start shorting.
it is making triangle pattern on daily chart in which important support zone is 2490 zone and Resistance is trendline
& today it is making inverse hammer candle which indicates bearish view for monday. On monday if this stocks breaks friday low then I will start shorting.
免責事項
これらの情報および投稿は、TradingViewが提供または保証する金融、投資、取引、またはその他の種類のアドバイスや推奨を意図したものではなく、またそのようなものでもありません。詳しくは利用規約をご覧ください。
免責事項
これらの情報および投稿は、TradingViewが提供または保証する金融、投資、取引、またはその他の種類のアドバイスや推奨を意図したものではなく、またそのようなものでもありません。詳しくは利用規約をご覧ください。