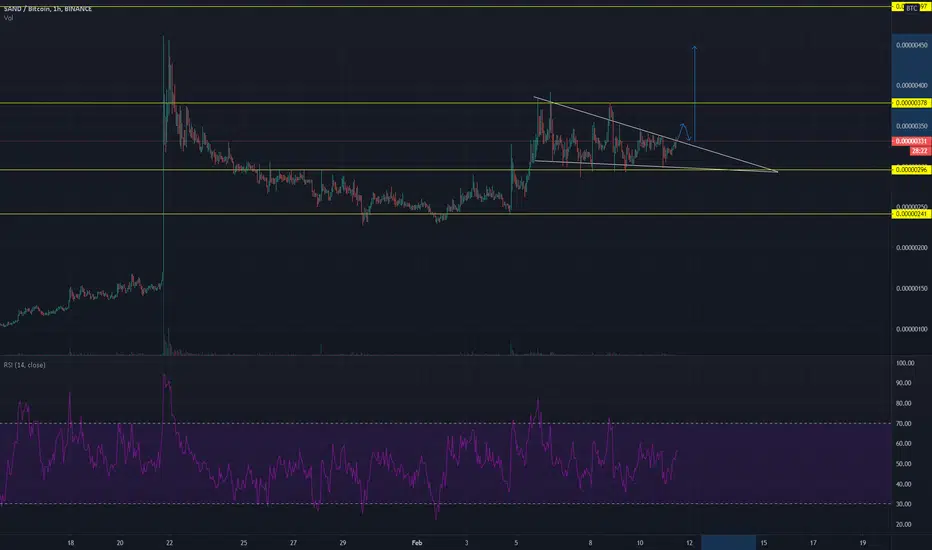
SAND/BTC on the 1hr chart is currently in a descending triangle and is holding strong at the 300 support level.
Waiting on the break of the triangle to retest and could be looking a some pretty good gains
Waiting on the break of the triangle to retest and could be looking a some pretty good gains
免責事項
これらの情報および投稿は、TradingViewが提供または保証する金融、投資、取引、またはその他の種類のアドバイスや推奨を意図したものではなく、またそのようなものでもありません。詳しくは利用規約をご覧ください。
免責事項
これらの情報および投稿は、TradingViewが提供または保証する金融、投資、取引、またはその他の種類のアドバイスや推奨を意図したものではなく、またそのようなものでもありません。詳しくは利用規約をご覧ください。