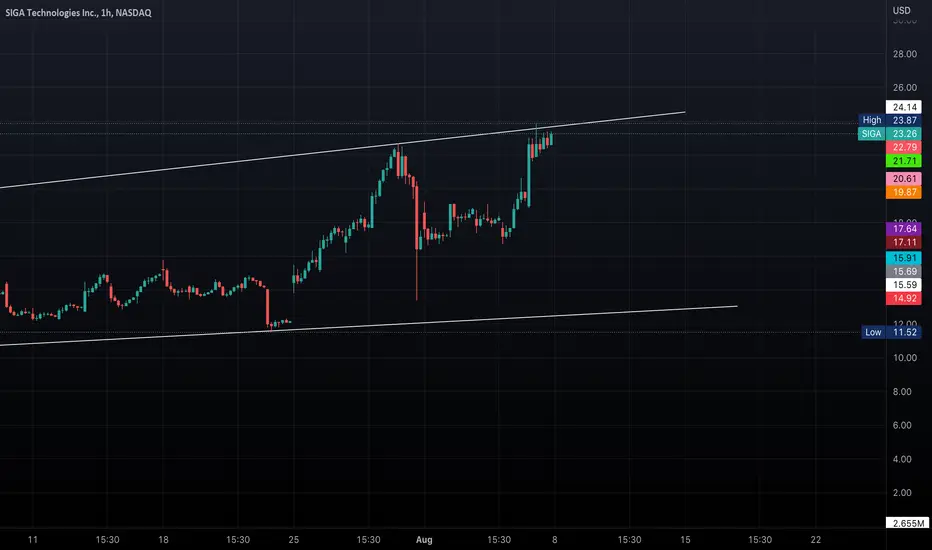
SIGA has an ascending channel pattern on the daily chart.
A closer look at SIGA shows a bull flag formation on the hourly chart.
I strongly believe that a break of the flag (on the hourly) will push SIGA above the upper trendline of the ascending channel (on the daily).
The measured potential maximum move of the bull flag is approximately 4.18 points and the measured potential maximum move of the ascending channel is approximately 15.90 points. Therefore, the combined potential maximum move approximation is 20.08 points.
Therefore, my entry will occur after price breaks and holds level 24.


*This is not financial advice.
Loved and Blessed,
MrALTrades00
A closer look at SIGA shows a bull flag formation on the hourly chart.
I strongly believe that a break of the flag (on the hourly) will push SIGA above the upper trendline of the ascending channel (on the daily).
The measured potential maximum move of the bull flag is approximately 4.18 points and the measured potential maximum move of the ascending channel is approximately 15.90 points. Therefore, the combined potential maximum move approximation is 20.08 points.
Therefore, my entry will occur after price breaks and holds level 24.
*This is not financial advice.
Loved and Blessed,
MrALTrades00
免責事項
これらの情報および投稿は、TradingViewが提供または保証する金融、投資、取引、またはその他の種類のアドバイスや推奨を意図したものではなく、またそのようなものでもありません。詳しくは利用規約をご覧ください。
免責事項
これらの情報および投稿は、TradingViewが提供または保証する金融、投資、取引、またはその他の種類のアドバイスや推奨を意図したものではなく、またそのようなものでもありません。詳しくは利用規約をご覧ください。