Research Notes
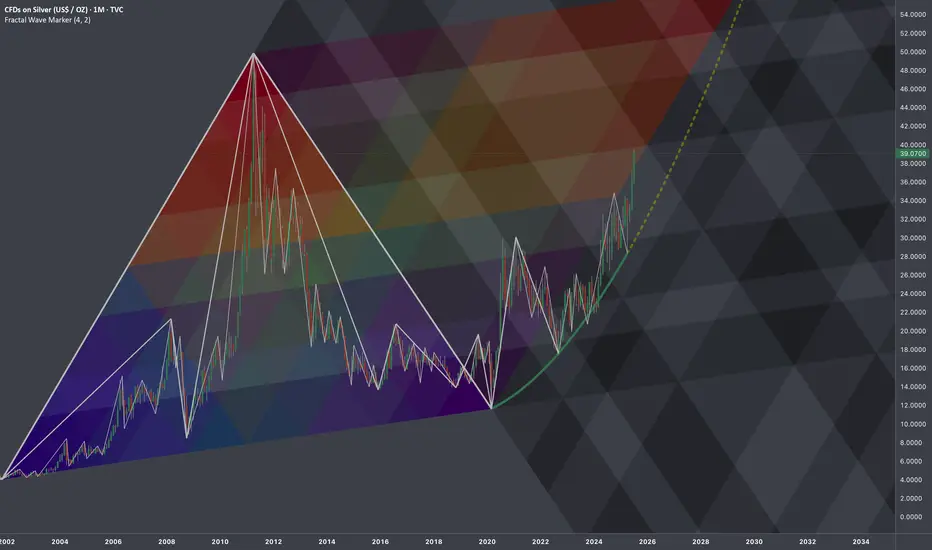
Working out probabilistic texture using multiple fibonacci channels on just 3 coordinates of fractal cycle (late 2001 - 2020) on linear scale (on log chart it would still be relevant, so you can switch to view with right click on price scale for selection).
I'd look for patterns of bullish exhaustion only after price crosses the curve.
Working out probabilistic texture using multiple fibonacci channels on just 3 coordinates of fractal cycle (late 2001 - 2020) on linear scale (on log chart it would still be relevant, so you can switch to view with right click on price scale for selection).
- To describe behavior of price and key levels on smaller scale starting from covid we'll use
L-H-L: - Using coordinates to express surface area of broken cycle with fibs mimicking rise, fall and side mapping cycle:
I'd look for patterns of bullish exhaustion only after price crosses the curve.
Unlock exclusive tools: fractlab.com
ᴀʟʟ ᴄᴏɴᴛᴇɴᴛ ᴘʀᴏᴠɪᴅᴇᴅ ʙʏ ꜰʀᴀᴄᴛʟᴀʙ ɪꜱ ɪɴᴛᴇɴᴅᴇᴅ ꜰᴏʀ ɪɴꜰᴏʀᴍᴀᴛɪᴏɴᴀʟ ᴀɴᴅ ᴇᴅᴜᴄᴀᴛɪᴏɴᴀʟ ᴘᴜʀᴘᴏꜱᴇꜱ ᴏɴʟʏ.
ᴘᴀꜱᴛ ᴘᴇʀꜰᴏʀᴍᴀɴᴄᴇ ɪꜱ ɴᴏᴛ ɪɴᴅɪᴄᴀᴛɪᴠᴇ ᴏꜰ ꜰᴜᴛᴜʀᴇ ʀᴇꜱᴜʟᴛꜱ.
ᴀʟʟ ᴄᴏɴᴛᴇɴᴛ ᴘʀᴏᴠɪᴅᴇᴅ ʙʏ ꜰʀᴀᴄᴛʟᴀʙ ɪꜱ ɪɴᴛᴇɴᴅᴇᴅ ꜰᴏʀ ɪɴꜰᴏʀᴍᴀᴛɪᴏɴᴀʟ ᴀɴᴅ ᴇᴅᴜᴄᴀᴛɪᴏɴᴀʟ ᴘᴜʀᴘᴏꜱᴇꜱ ᴏɴʟʏ.
ᴘᴀꜱᴛ ᴘᴇʀꜰᴏʀᴍᴀɴᴄᴇ ɪꜱ ɴᴏᴛ ɪɴᴅɪᴄᴀᴛɪᴠᴇ ᴏꜰ ꜰᴜᴛᴜʀᴇ ʀᴇꜱᴜʟᴛꜱ.
免責事項
これらの情報および投稿は、TradingViewが提供または保証する金融、投資、取引、またはその他の種類のアドバイスや推奨を意図したものではなく、またそのようなものでもありません。詳しくは利用規約をご覧ください。