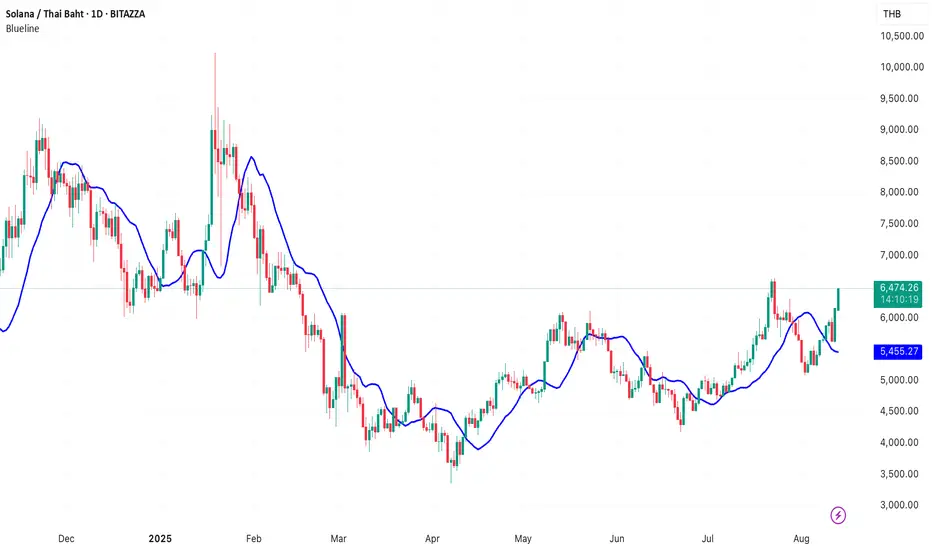
SOL has broken above its descending trendline, signaling a potential shift in momentum. If the price can clear the key resistance at 6,600 THB, the broader trend will turn bullish, supported by a Golden Cross as the 50-day EMA crosses above the 200-day EMA. The medium-term target is a retest of the previous high at 10,000 THB.
Trading Strategy:
A buy entry can be considered near the support level at 5,437 THB in case of a pullback.
A stop-loss should be placed at 5,075 THB to limit downside risk.
If SOL retests 6,600 THB and breaks through, it would confirm a strong bullish reversal, opening the way toward the 10,000 THB target.
Fundamentally, SOL is benefiting from anticipation of SOL ETF approvals and increased institutional interest, as publicly listed companies add SOL to their investment portfolios.
免責事項
これらの情報および投稿は、TradingViewが提供または保証する金融、投資、取引、またはその他の種類のアドバイスや推奨を意図したものではなく、またそのようなものでもありません。詳しくは利用規約をご覧ください。
免責事項
これらの情報および投稿は、TradingViewが提供または保証する金融、投資、取引、またはその他の種類のアドバイスや推奨を意図したものではなく、またそのようなものでもありません。詳しくは利用規約をご覧ください。