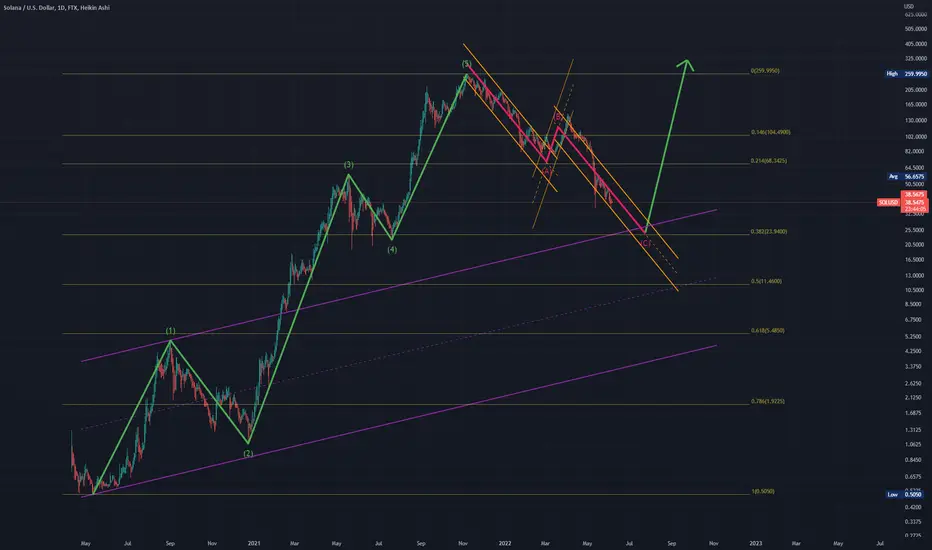
In green are waves 1, 2, 3, 4 & 5 of the larger wave 1.
In purple is the base channel formed by waves 1 & 2 of the larger wave 1.
In red is the path of waves A, B & C of the larger wave 2.
In orange are the channels for waves A, B & C of the larger wave 2.
When wave c of the larger wave 2 hits into the base channel, it will also be near the 0.382 fibonacci retracement at $23.94.
Could this be when it starts its way up to begin the larger wave 3 (the green arrow)?
I am pretty new to this, so any input as to why this may or may not be the case or what I got right or wrong would or whether you agree or disagree be greatly appreciated.
Hope you liked it. Thanks everyone, have a great day!
ノート
Note: Chart is heiken ashi/logarithmic view and fib levels are also based on log view.ノート
Just published a new idea I think is even better, please check it out!免責事項
これらの情報および投稿は、TradingViewが提供または保証する金融、投資、取引、またはその他の種類のアドバイスや推奨を意図したものではなく、またそのようなものでもありません。詳しくは利用規約をご覧ください。
免責事項
これらの情報および投稿は、TradingViewが提供または保証する金融、投資、取引、またはその他の種類のアドバイスや推奨を意図したものではなく、またそのようなものでもありません。詳しくは利用規約をご覧ください。