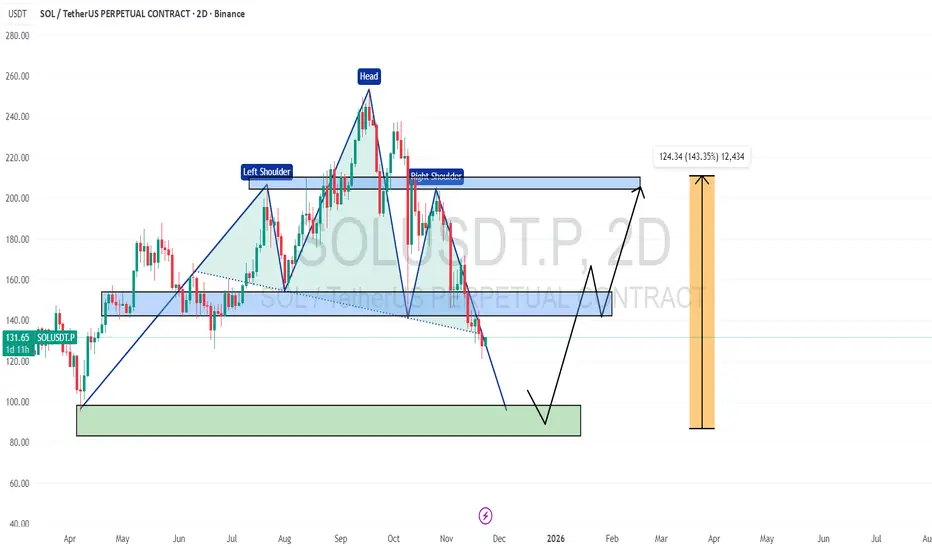
📌 SOL 2D Chart shows a head & shoulder pattern✅
📌 If this continues, the price may continue to decline ✅
📌 However, a bullish reversal is expected from the support zone below ✅
If this happens, the price may go back to the $150, $200+ range 🔥🚀
📌 If this continues, the price may continue to decline ✅
📌 However, a bullish reversal is expected from the support zone below ✅
If this happens, the price may go back to the $150, $200+ range 🔥🚀
Join My Free Signal Channel ➡ t.me/Leo524
免責事項
この情報および投稿は、TradingViewが提供または推奨する金融、投資、トレード、その他のアドバイスや推奨を意図するものではなく、それらを構成するものでもありません。詳細は利用規約をご覧ください。
Join My Free Signal Channel ➡ t.me/Leo524
免責事項
この情報および投稿は、TradingViewが提供または推奨する金融、投資、トレード、その他のアドバイスや推奨を意図するものではなく、それらを構成するものでもありません。詳細は利用規約をご覧ください。