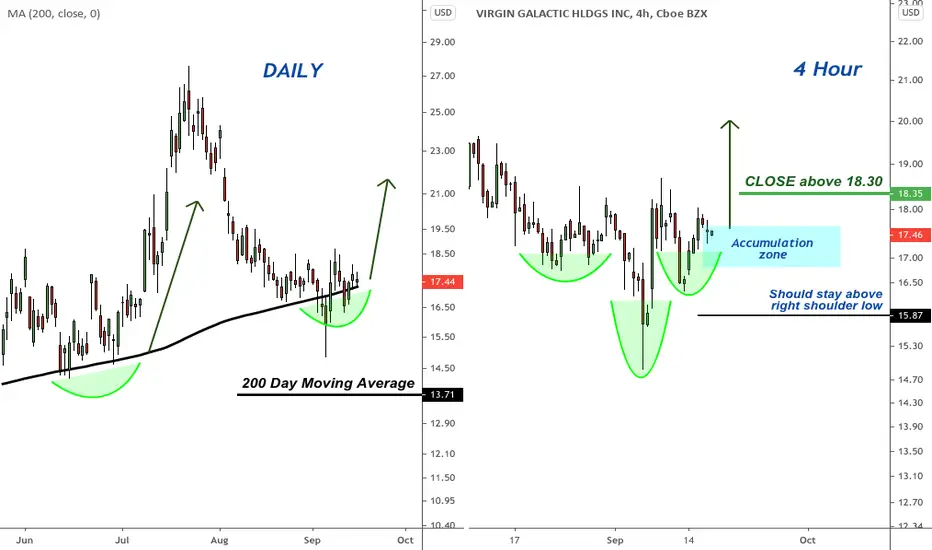
On the left chart we're looking at the Daily time frame. Notice price is currently resting at the 200 day moving average after reclaiming it earlier this month.
That's positive.
On the right chart we're looking at the 240 min/4hr time frame where price currently displays a possible H&S construction. The stock is at a good accumulation zone here as long as the recent lows hold.
A CLOSE above 18.30 on the 4hr or daily chart can give conservative traders confirmation to get long. Aggressive traders could start buying inside the accumulation zone with stops under the black line I drew (a CLOSE under it would be needed to invalidate the position).
トレード終了: ストップロスに到達
Manually stopped todayノート
Massive bottom confirmed after today's price action. My buy stops were triggered at 18.30. If I didn't have buy stops resting I would have missed this trade as my aggressive entries at 17 were all stopped out.ノート
2 week time-frame is breaking out of the triangle. SPCE could be trading in the 30s soon:免責事項
これらの情報および投稿は、TradingViewが提供または保証する金融、投資、取引、またはその他の種類のアドバイスや推奨を意図したものではなく、またそのようなものでもありません。詳しくは利用規約をご覧ください。
免責事項
これらの情報および投稿は、TradingViewが提供または保証する金融、投資、取引、またはその他の種類のアドバイスや推奨を意図したものではなく、またそのようなものでもありません。詳しくは利用規約をご覧ください。