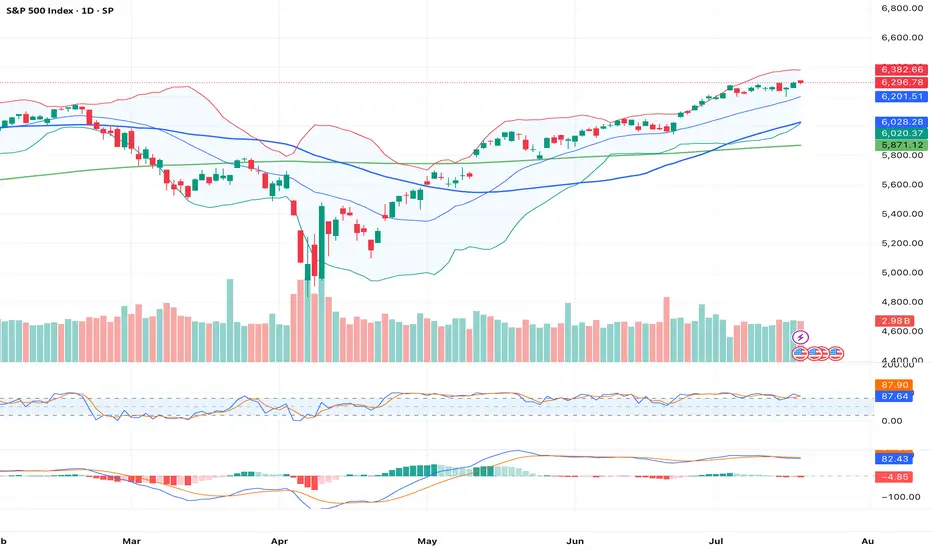
This chart represents the 1-day (Daily timeframe) price action of the S&P 500 Index (SPX), offering a focused view of market sentiment, key levels, and trend momentum as of [Today’s Date]. Each candlestick reflects a full trading day.
📊 Chart Parameters:
Instrument: S&P 500 Index (SPX)
Timeframe: 1D (1-Day)
Exchange: NYSE / NASDAQ Composite (tracked as index)
Date Range Displayed: Past 3–6 months (approx.)
📊 Chart Parameters:
Instrument: S&P 500 Index (SPX)
Timeframe: 1D (1-Day)
Exchange: NYSE / NASDAQ Composite (tracked as index)
Date Range Displayed: Past 3–6 months (approx.)
免責事項
これらの情報および投稿は、TradingViewが提供または保証する金融、投資、取引、またはその他の種類のアドバイスや推奨を意図したものではなく、またそのようなものでもありません。詳しくは利用規約をご覧ください。
免責事項
これらの情報および投稿は、TradingViewが提供または保証する金融、投資、取引、またはその他の種類のアドバイスや推奨を意図したものではなく、またそのようなものでもありません。詳しくは利用規約をご覧ください。