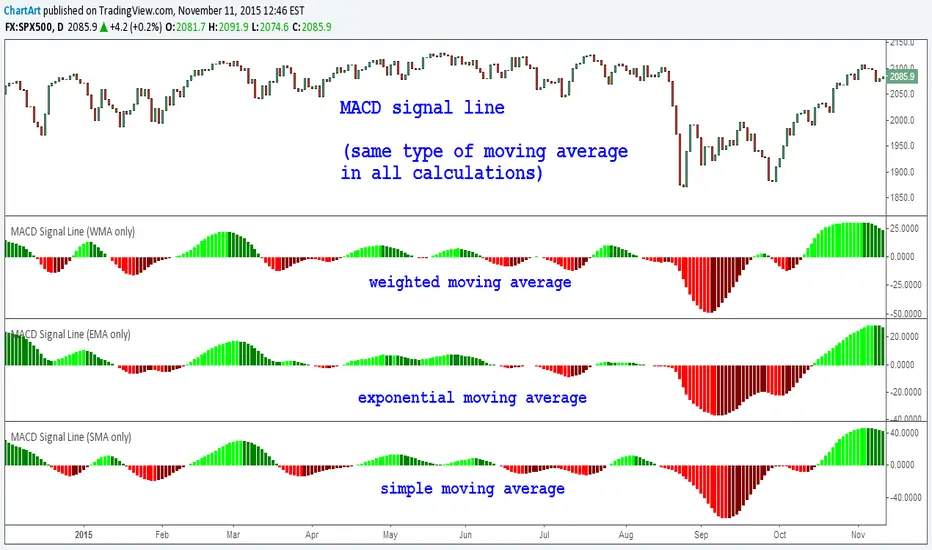
This is my research into the behavior of different moving average calculations to different aspects of the MACD. The MACD consists of three parts:
This is part three of my research which only shows the signal line of the purely WMA / EMA / SMA based MACD.
Here is part one, the histogram of the MACD:
![[STUDY] MACD. Part 1: Histogram (Comparison of moving averages)](https://s3.tradingview.com/e/eRSEmsKW_mid.png)
And here you can find part two, the original MACD itself:
![[STUDY] MACD. Part 2: MACD (Comparison of moving averages)](https://s3.tradingview.com/d/DGqbSSAk_mid.png)
- 1. The MACD (moving average convergence/divergence of the fast moving average period 12 versus the slower moving average period 26)
- 2. The signal line (moving average period 9) of the MACD
- 3. The histogram of the MACD (difference between MACD and the signal line)
This is part three of my research which only shows the signal line of the purely WMA / EMA / SMA based MACD.
Here is part one, the histogram of the MACD:
And here you can find part two, the original MACD itself:
関連の投稿
免責事項
これらの情報および投稿は、TradingViewが提供または保証する金融、投資、取引、またはその他の種類のアドバイスや推奨を意図したものではなく、またそのようなものでもありません。詳しくは利用規約をご覧ください。
関連の投稿
免責事項
これらの情報および投稿は、TradingViewが提供または保証する金融、投資、取引、またはその他の種類のアドバイスや推奨を意図したものではなく、またそのようなものでもありません。詳しくは利用規約をご覧ください。