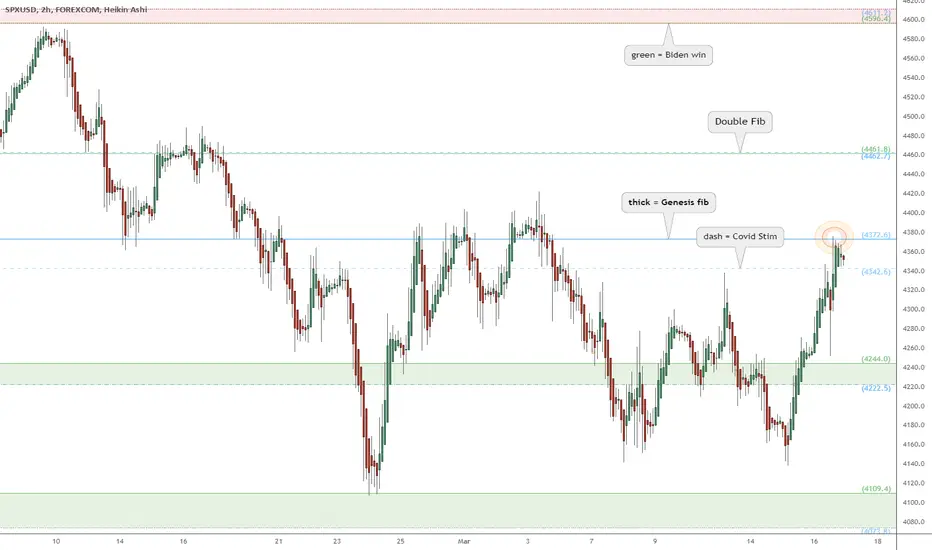
Plotted are 3 different sets of Fibonacci Extensions.
Each fib is like a "ruler" calibrated to a specific wave.
Every level is relevant, especially the confluence zones.
4372.6 is the key level to break and hold as bottom marker.
4343.6 is immediate support that strong bull would hold.
4222-4224 is key support for bulls to defend as a higher low.
4073-4019 should have been the bottom and NOT be retested.
The origin of the above fibs are shown in this DAILY View (click).
.
the Golden Ratio is my Religion
the Trading View is my Nation
the Moderator Tag is my Flag
the Trading View is my Nation
the Moderator Tag is my Flag
関連の投稿
免責事項
これらの情報および投稿は、TradingViewが提供または保証する金融、投資、取引、またはその他の種類のアドバイスや推奨を意図したものではなく、またそのようなものでもありません。詳しくは利用規約をご覧ください。
the Golden Ratio is my Religion
the Trading View is my Nation
the Moderator Tag is my Flag
the Trading View is my Nation
the Moderator Tag is my Flag
関連の投稿
免責事項
これらの情報および投稿は、TradingViewが提供または保証する金融、投資、取引、またはその他の種類のアドバイスや推奨を意図したものではなく、またそのようなものでもありません。詳しくは利用規約をご覧ください。