STPL Technical Analysis (Pakistan Stock Exchange)
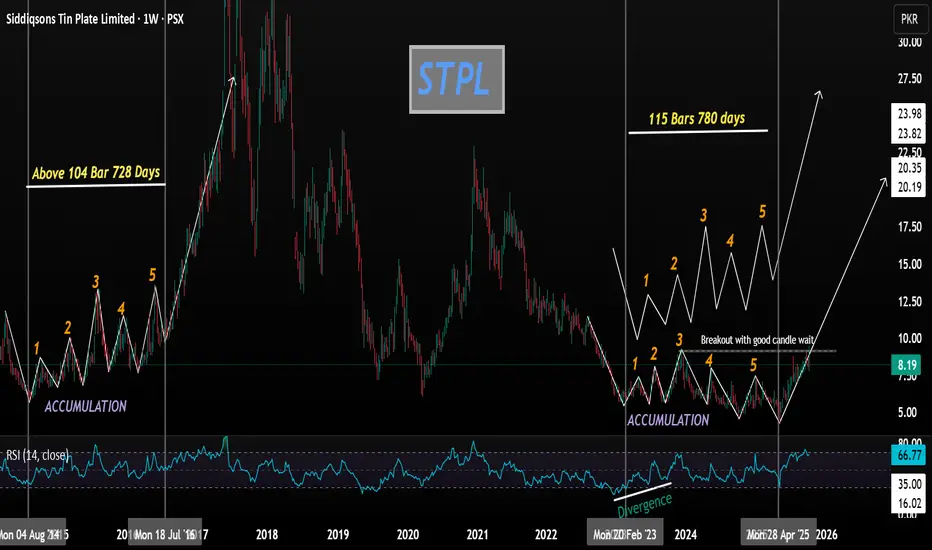
Based on a thorough analysis of STPL's time cycles and price structure, the stock exhibits a pattern similar to the one observed between 2014 and 2016. During that period, STPL spent significant time forming a structured five-point pattern (1, 2, 3, 4, 5), where point 3 marked a key high that eventually broke out, reaching a peak of 40.
Currently, the stock is forming an almost identical pattern, again showing a clear five-point structure (1, 2, 3, 4, 5), with point 3 acting as a crucial high—mirroring the previous cycle.
The key resistance at 9.3 (corresponding to the previous point 3 high) was recently tested, and the price touched 9.45 with significant volume on the last weak candle. Following this, the price pulled back, creating a potential entry zone. A strong candle formation at this level would confirm a favorable entry opportunity.
Based on this analysis:
First target: 20
Second target: 30
Ultimate target: 40
All indications suggest that the stock is likely to achieve these targets smoothly, following the same cycle and character as the previous accumulation and breakout pattern.
免責事項
これらの情報および投稿は、TradingViewが提供または保証する金融、投資、取引、またはその他の種類のアドバイスや推奨を意図したものではなく、またそのようなものでもありません。詳しくは利用規約をご覧ください。
免責事項
これらの情報および投稿は、TradingViewが提供または保証する金融、投資、取引、またはその他の種類のアドバイスや推奨を意図したものではなく、またそのようなものでもありません。詳しくは利用規約をご覧ください。