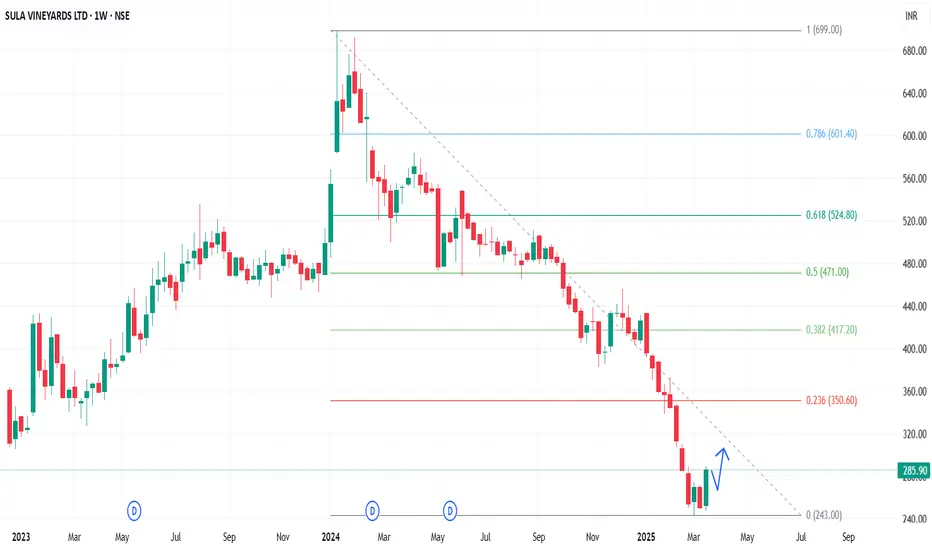
In the Weekly Chart of SULA ,
we can see that; it is showing a W shape recovery from 240-245 level.
wait for a Halt or retrace candle and then enter with SL and Targets.
Expected momentum is shared in chart.
we can see that; it is showing a W shape recovery from 240-245 level.
wait for a Halt or retrace candle and then enter with SL and Targets.
Expected momentum is shared in chart.
免責事項
この情報および投稿は、TradingViewが提供または推奨する金融、投資、トレード、その他のアドバイスや推奨を意図するものではなく、それらを構成するものでもありません。詳細は利用規約をご覧ください。
免責事項
この情報および投稿は、TradingViewが提供または推奨する金融、投資、トレード、その他のアドバイスや推奨を意図するものではなく、それらを構成するものでもありません。詳細は利用規約をご覧ください。