Macro Divergence Signals Building a Major Correction
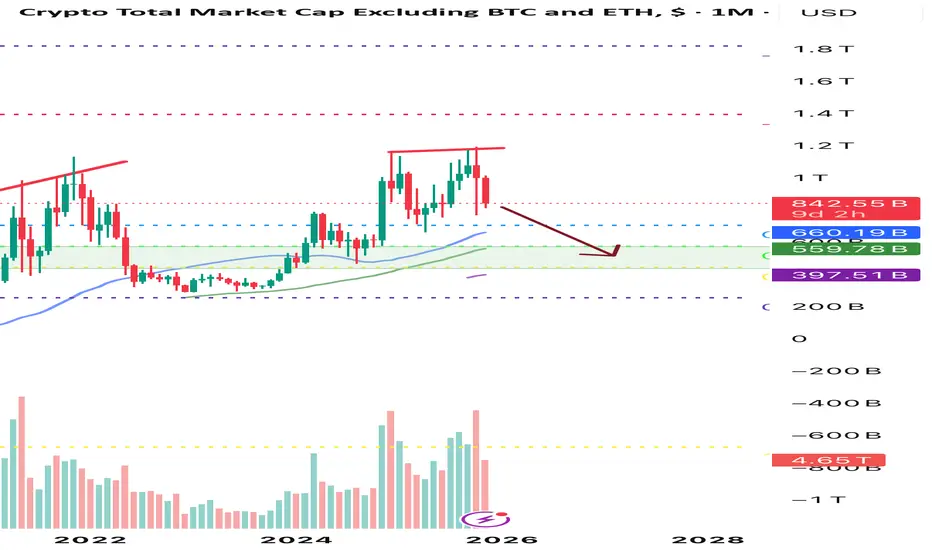
The chart is showing a clear structural mismatch between price action and momentum—something that rarely appears on the monthly timeframe unless the market is entering a distribution → correction cycle.
1) Bearish Divergence Across Two Key Momentum Indicators
• Price made a Higher High, but
• RSI printed a Lower High
• MACD Histogram also printed a Lower High
This multi-layer divergence reflects a loss of internal momentum even as price pushed higher. It means the move was driven by late liquidity (mainly retail), not strong institutional demand.
2) Market Mechanics Behind the Signal
When price rises while momentum falls, the market enters a state of liquidity exhaustion:
• Smart money starts distributing at the top
• Retail investors enter late due to FOMO
• Price continues rising on emotional demand, not real strength
This creates a fragile structure that usually resolves through a mean-reversion correction.
3) Expected Scenario
Based on the divergence + fading volume + historical behavior of TOTAL3:
• A correction toward the 0.5 – 0.618 Fibonacci retracement zone is the most probable path
• This area (around 450–500B) is where market structure can reset and long-term buyers return
• The move would mirror the macro corrections seen in 2022 and 2018
4) Technical Outlook
The arrow scenario on the chart aligns with:
• Divergence-driven momentum decay
• Breakdown from a local top
• Reversion toward the value zone before the next macro expansion phase
It is just a healthy macro recalibration before the next cycle.
免責事項
この情報および投稿は、TradingViewが提供または推奨する金融、投資、トレード、その他のアドバイスや推奨を意図するものではなく、それらを構成するものでもありません。詳細は利用規約をご覧ください。
免責事項
この情報および投稿は、TradingViewが提供または推奨する金融、投資、トレード、その他のアドバイスや推奨を意図するものではなく、それらを構成するものでもありません。詳細は利用規約をご覧ください。