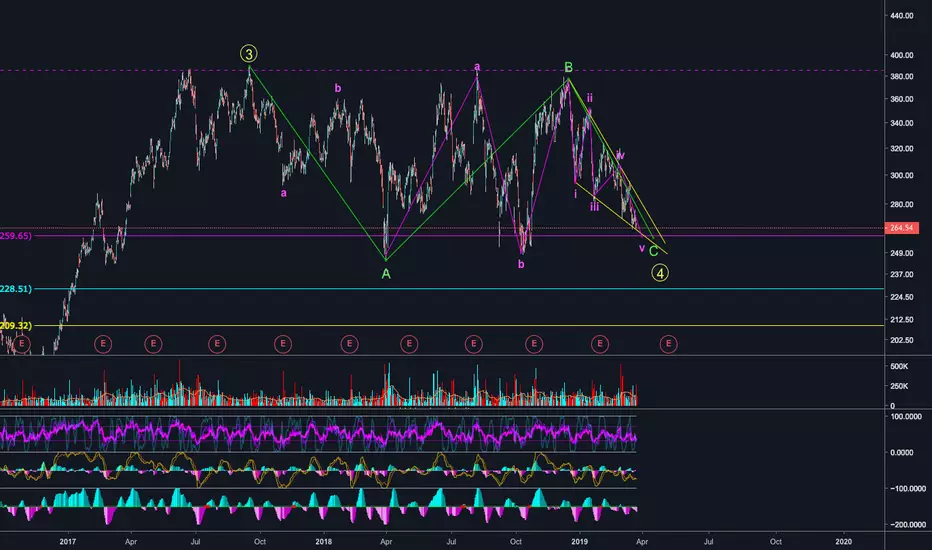
It's unclear if the wave structure is complete, but right now it looks like we have an ABC flat on both charts.
Interestingly, TSLA looks like it's in a Wave 4 (meaning up afterwards) while NIO is below its initial IPO price. So the question is, do both stocks trend together? So far the similar wave pattern would suggest it.
Interestingly, TSLA looks like it's in a Wave 4 (meaning up afterwards) while NIO is below its initial IPO price. So the question is, do both stocks trend together? So far the similar wave pattern would suggest it.
ノート
NIO chart:免責事項
これらの情報および投稿は、TradingViewが提供または保証する金融、投資、取引、またはその他の種類のアドバイスや推奨を意図したものではなく、またそのようなものでもありません。詳しくは利用規約をご覧ください。
免責事項
これらの情報および投稿は、TradingViewが提供または保証する金融、投資、取引、またはその他の種類のアドバイスや推奨を意図したものではなく、またそのようなものでもありません。詳しくは利用規約をご覧ください。