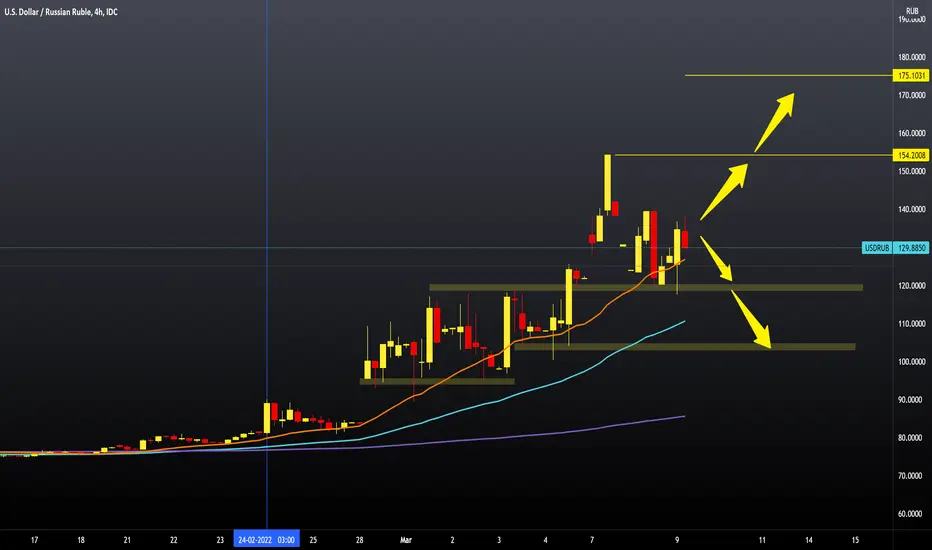
After the Russian ruble climbed to an all-time high of 154,200 on Monday, we now have a bearish consolidation where the USDRUB pair is seeking potential support. For now, we find support at 120,000, and the pair fails to make a new break above 140,000. USDRUB has already formed twice on the lower high chart, which is a sign of the weakening dollar and the strengthening of the Russian ruble. If this trend continues, there is a chance that we will visit the psychological 100,000 level before the next stronger bullish impulse. Moving averages are on the bullish side, and based on them, and we can expect further continuation. Russia has abolished the value-added tax for gold buyers and banned the purchase of foreign currencies as a measure to strengthen its currency. The situation in Ukraine remains volatile, and any news, whether positive or negative, may affect the USDRUB.
免責事項
これらの情報および投稿は、TradingViewが提供または保証する金融、投資、取引、またはその他の種類のアドバイスや推奨を意図したものではなく、またそのようなものでもありません。詳しくは利用規約をご覧ください。
免責事項
これらの情報および投稿は、TradingViewが提供または保証する金融、投資、取引、またはその他の種類のアドバイスや推奨を意図したものではなく、またそのようなものでもありません。詳しくは利用規約をご覧ください。