This is a very interesting stock, which it had been dropped 50% for 3 months in early 2021. And starting to rebound and dropped and rebounded.
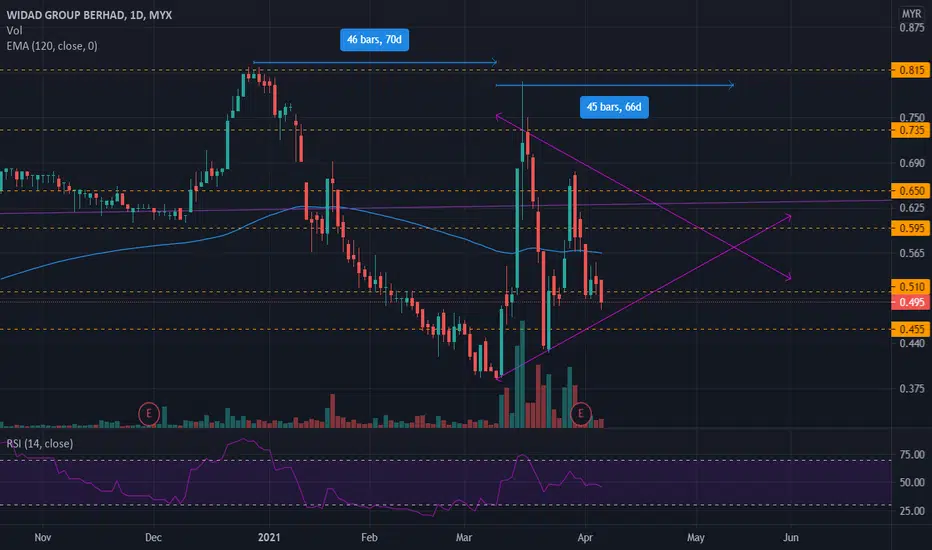
By seeing the rebound pattern, it has formed a triangle which trend direction is still unclear. But the graph may bound inside the triangle forming top breakout, or dropped lower.
EMA 120 shows 0.565-0.570 which separating the direction of the trend.
It is interesting to keep in view.
By seeing the rebound pattern, it has formed a triangle which trend direction is still unclear. But the graph may bound inside the triangle forming top breakout, or dropped lower.
EMA 120 shows 0.565-0.570 which separating the direction of the trend.
It is interesting to keep in view.
手動でトレードを終了しました
If it is out from the gradient, it is no longer following the pattern. Shall wait for another support.免責事項
これらの情報および投稿は、TradingViewが提供または保証する金融、投資、取引、またはその他の種類のアドバイスや推奨を意図したものではなく、またそのようなものでもありません。詳しくは利用規約をご覧ください。
免責事項
これらの情報および投稿は、TradingViewが提供または保証する金融、投資、取引、またはその他の種類のアドバイスや推奨を意図したものではなく、またそのようなものでもありません。詳しくは利用規約をご覧ください。