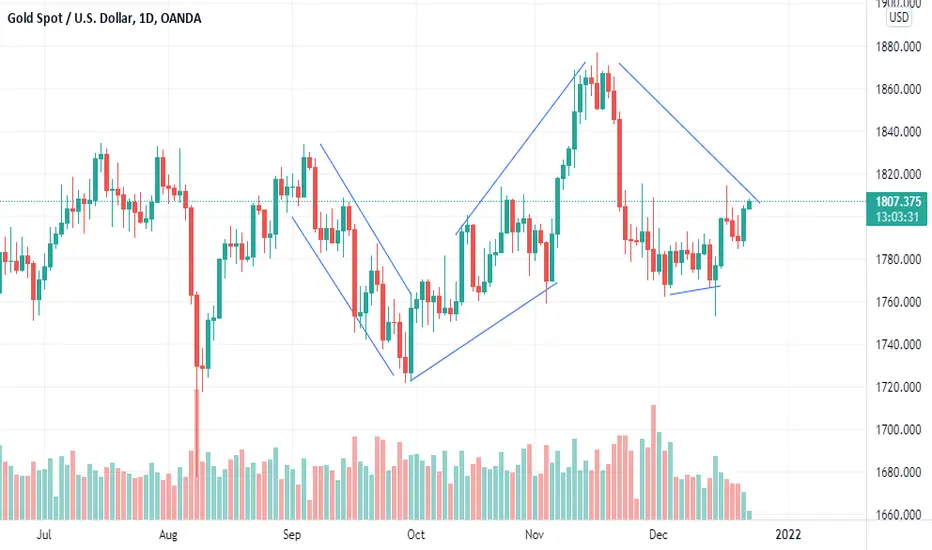
A chart pattern is a shape within a price chart that helps to suggest what prices might do next, based on what they have done in the past. Chart patterns are the basis of technical analysis and require a trader to know exactly what they are looking at, as well as what they are looking for.
免責事項
これらの情報および投稿は、TradingViewが提供または保証する金融、投資、取引、またはその他の種類のアドバイスや推奨を意図したものではなく、またそのようなものでもありません。詳しくは利用規約をご覧ください。
免責事項
これらの情報および投稿は、TradingViewが提供または保証する金融、投資、取引、またはその他の種類のアドバイスや推奨を意図したものではなく、またそのようなものでもありません。詳しくは利用規約をご覧ください。