OPEN-SOURCE SCRIPT
Midnight and 7:30 AM Open with Reset
Extreme Discount and Extreme Premium Indicator
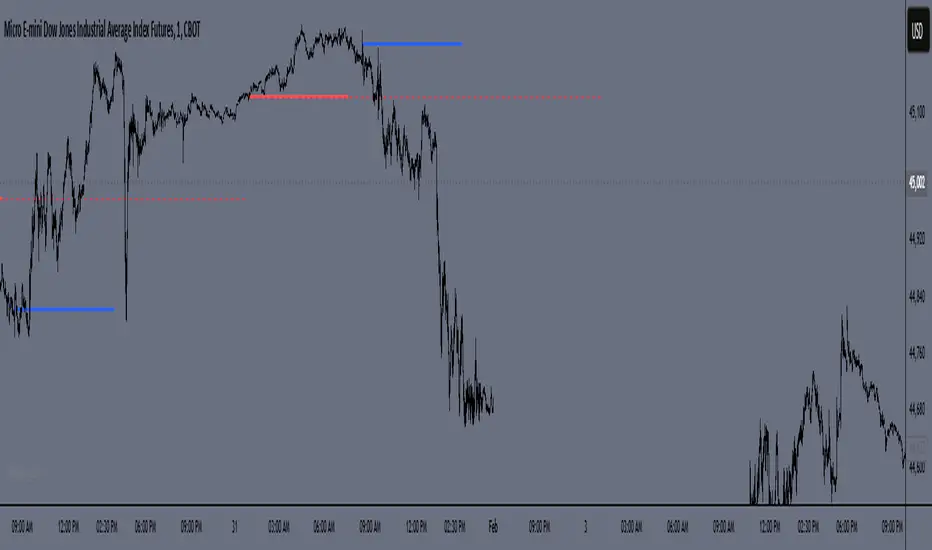
This custom indicator identifies the relationship between the current price and key discount and premium levels on the chart. It helps determine whether the price is in an "extreme discount" or "extreme premium" zone, which can be important for making trading decisions based on market structure.
Extreme Discount Zone: The indicator identifies the "extreme discount" zone when the price is below both its extreme discount levels, indicating that the market is in a potential buying area, which could signal a reversal or a good entry point to buy.
Extreme Premium Zone: The indicator marks the "extreme premium" zone when the price is above both its extreme premium levels, suggesting that the market is in a potential selling area, signaling a possible price reversal or a good entry point to sell.
The indicator dynamically adjusts and highlights these zones based on price movement, allowing traders to visualize when the price is reaching extreme levels relative to historical price action.
Key Features:
Detects when the current price is below both extreme discount levels.
Detects when the current price is above both extreme premium levels.
Highlights these extreme areas visually to help traders make informed decisions on buying or selling.
オープンソーススクリプト
TradingViewの精神に則り、このスクリプトの作者はコードをオープンソースとして公開してくれました。トレーダーが内容を確認・検証できるようにという配慮です。作者に拍手を送りましょう!無料で利用できますが、コードの再公開はハウスルールに従う必要があります。
免責事項
この情報および投稿は、TradingViewが提供または推奨する金融、投資、トレード、その他のアドバイスや推奨を意図するものではなく、それらを構成するものでもありません。詳細は利用規約をご覧ください。
オープンソーススクリプト
TradingViewの精神に則り、このスクリプトの作者はコードをオープンソースとして公開してくれました。トレーダーが内容を確認・検証できるようにという配慮です。作者に拍手を送りましょう!無料で利用できますが、コードの再公開はハウスルールに従う必要があります。
免責事項
この情報および投稿は、TradingViewが提供または推奨する金融、投資、トレード、その他のアドバイスや推奨を意図するものではなく、それらを構成するものでもありません。詳細は利用規約をご覧ください。