INVITE-ONLY SCRIPT
Ranger
Indicator Ranger
Class: oscillator
Type of trading: intraday
Period: daily
Description
A lot of technical indicators are based on quite doubtful assumptions and unconfirmed patterns. One more typical drawback is absence of signals from indicators in form of absolute price values (this also concerns stop-loss and take-profit parameters). As the result it is hard to determine the exact entry and exit points for the trade. This is very important both for the beginners and experienced traders.
Developing Ranger we were trying to solve this problem and to create extremely simple and at the same scientifically based indicator.
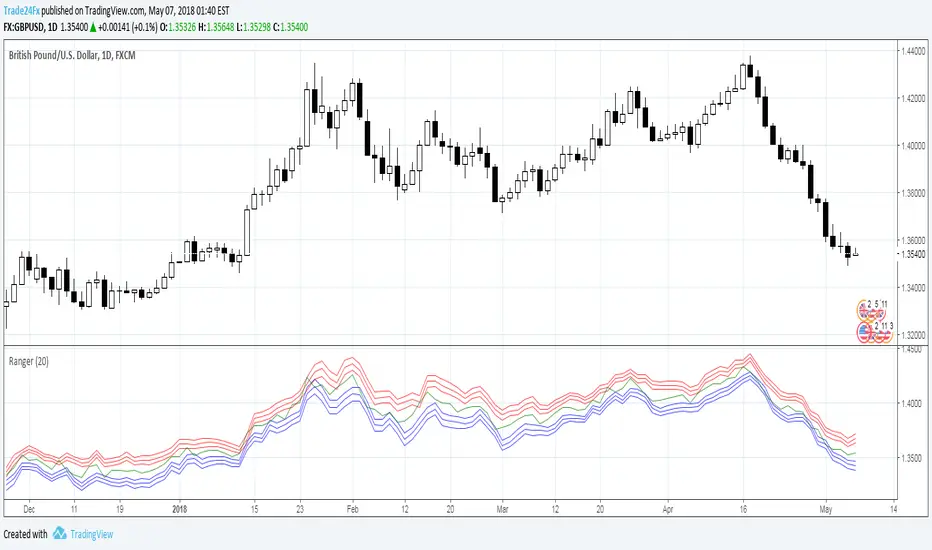
Ranger is based on statistical analysis of the data and provides information about possible maximum/minimum values of the day (just right after the day has started) with certain probabilities. So called synthetic support and resistance levels.
For example at 00:00 am EURUSD open price is 1.1350 Ranger will generate a number of price values which will indicate possible minimum/maximum of the day. It can be something like 1.1440 (high of the day with probability 75%) and 1.1260 (low of the day with probability 75%). Current version of the indicator can generate up to 3 high/low values with probabilities 70%, 95% and 99%. By probability we mean chance that the price will not go above/below generated high/low value.
What does this information give to the trader? Actually, a lot. First of all, trading signals. For example, if during a day the price approaches the upper (lower) mark, it can be concluded that it will not go higher (lower) prescribed mark today with already known probability. So, you can open a position opposite to the current movement, knowing in advance that it will be profitable with certain probability. For the full information about signals from Ranger see the “Trading signals” section.
Structure of the Indicator Ranger
1. Three blue lines – synthetic support lines. They describe 3 different buy zones with certain probabilities of success:
- First blue line (Buy zone #1) - the price today will not fall below this mark with a probability of 68%;
- Second blue line (Buy zone #2)- the price today will not fall below this mark with a probability of 95%;
- Third blue line (Buy zone #3) - the price today will not fall below this mark with a probability of 99%.
2. Three red lines – synthetic resistance lines. They describe 3 different sell zones with certain probabilities of success:
- First red line (Sell zone #1) - the price today will not rise above this mark with a probability of 68%;
- Second red line (Sell zone #2) - the price today will not rise above this mark with a probability of 95%;
- Third red line (Sell zone #3) - the price today will not rise above this mark with a probability of 99%.
3. Green line – shows current price. When it gets close to the red/blue line sell/buy signals are generated.
Trading rules
General rules are as follows: buy at the blue lines, sell at the red lines.
Take-profits for sells are set at the nearest blue line, for buys – at the nearest red line. Stop-losses for sells are set above the last red line, for buys – below the last blue line.
Class: oscillator
Type of trading: intraday
Period: daily
Description
A lot of technical indicators are based on quite doubtful assumptions and unconfirmed patterns. One more typical drawback is absence of signals from indicators in form of absolute price values (this also concerns stop-loss and take-profit parameters). As the result it is hard to determine the exact entry and exit points for the trade. This is very important both for the beginners and experienced traders.
Developing Ranger we were trying to solve this problem and to create extremely simple and at the same scientifically based indicator.
Ranger is based on statistical analysis of the data and provides information about possible maximum/minimum values of the day (just right after the day has started) with certain probabilities. So called synthetic support and resistance levels.
For example at 00:00 am EURUSD open price is 1.1350 Ranger will generate a number of price values which will indicate possible minimum/maximum of the day. It can be something like 1.1440 (high of the day with probability 75%) and 1.1260 (low of the day with probability 75%). Current version of the indicator can generate up to 3 high/low values with probabilities 70%, 95% and 99%. By probability we mean chance that the price will not go above/below generated high/low value.
What does this information give to the trader? Actually, a lot. First of all, trading signals. For example, if during a day the price approaches the upper (lower) mark, it can be concluded that it will not go higher (lower) prescribed mark today with already known probability. So, you can open a position opposite to the current movement, knowing in advance that it will be profitable with certain probability. For the full information about signals from Ranger see the “Trading signals” section.
Structure of the Indicator Ranger
1. Three blue lines – synthetic support lines. They describe 3 different buy zones with certain probabilities of success:
- First blue line (Buy zone #1) - the price today will not fall below this mark with a probability of 68%;
- Second blue line (Buy zone #2)- the price today will not fall below this mark with a probability of 95%;
- Third blue line (Buy zone #3) - the price today will not fall below this mark with a probability of 99%.
2. Three red lines – synthetic resistance lines. They describe 3 different sell zones with certain probabilities of success:
- First red line (Sell zone #1) - the price today will not rise above this mark with a probability of 68%;
- Second red line (Sell zone #2) - the price today will not rise above this mark with a probability of 95%;
- Third red line (Sell zone #3) - the price today will not rise above this mark with a probability of 99%.
3. Green line – shows current price. When it gets close to the red/blue line sell/buy signals are generated.
Trading rules
General rules are as follows: buy at the blue lines, sell at the red lines.
Take-profits for sells are set at the nearest blue line, for buys – at the nearest red line. Stop-losses for sells are set above the last red line, for buys – below the last blue line.
招待専用スクリプト
このスクリプトは作者が承認したユーザーのみアクセス可能です。使用するにはアクセス申請をして許可を得る必要があります。通常は支払い後に承認されます。詳細は下記の作者の指示に従うか、Trade24Fxに直接お問い合わせください。
TradingViewは、作者を完全に信頼し、スクリプトの動作を理解していない限り、有料スクリプトの購入・使用を推奨しません。コミュニティスクリプトには無料のオープンソースの代替が多数あります。
作者の指示
Авторские индикаторы
bit.ly/2oBvkHY
Больше информации на нашем ютьюб-канале
youtube.com/channel/UCYEOurJfasXWyYnrriGwsqQ
bit.ly/2oBvkHY
Больше информации на нашем ютьюб-канале
youtube.com/channel/UCYEOurJfasXWyYnrriGwsqQ
免責事項
この情報および投稿は、TradingViewが提供または推奨する金融、投資、トレード、その他のアドバイスや推奨を意図するものではなく、それらを構成するものでもありません。詳細は利用規約をご覧ください。