OPEN-SOURCE SCRIPT
更新済 Cumulative Volume Delta with EMA Plot
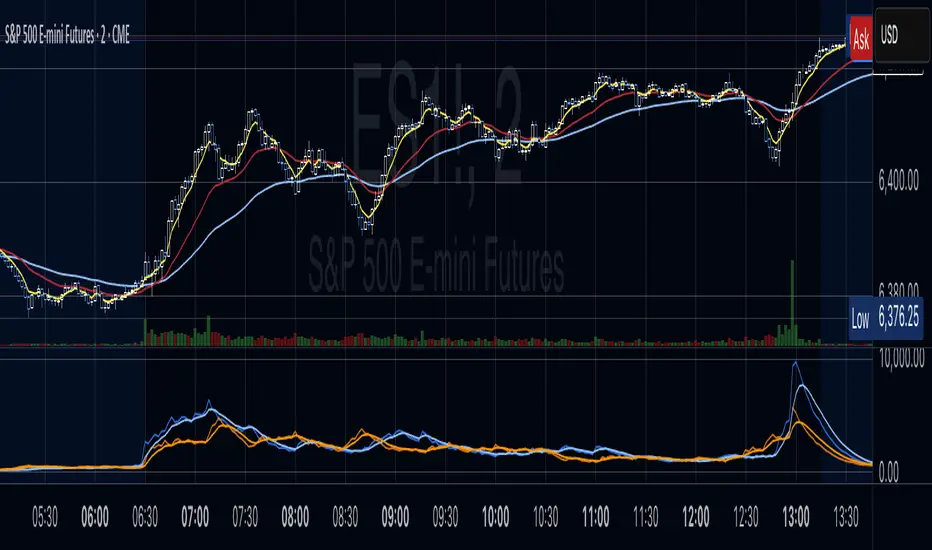
Cumulative Delta Volume is a key tool for analyzing the relationship between trading volume and price movement, often referred to as Volume Price Action.
In this indicator, an Exponential Moving Average (EMA) is applied to smooth out short-term noise and reduce volatility, making trends easier to identify. Traders can watch for EMA crossovers as confirmation signals for potential trend reversals, as well as buying or selling opportunities.
In this indicator, an Exponential Moving Average (EMA) is applied to smooth out short-term noise and reduce volatility, making trends easier to identify. Traders can watch for EMA crossovers as confirmation signals for potential trend reversals, as well as buying or selling opportunities.
リリースノート
Cumulative Delta Volume is a key tool for analyzing the relationship between trading volume and price movement, often referred to as Volume Price Action.In this indicator, an Exponential Moving Average (EMA) is applied to smooth out short-term noise and reduce volatility, making trends easier to identify. Traders can watch for EMA crossovers as confirmation signals for potential trend reversals, as well as buying or selling opportunities.
オープンソーススクリプト
TradingViewの精神に則り、このスクリプトの作者はコードをオープンソースとして公開してくれました。トレーダーが内容を確認・検証できるようにという配慮です。作者に拍手を送りましょう!無料で利用できますが、コードの再公開はハウスルールに従う必要があります。
免責事項
この情報および投稿は、TradingViewが提供または推奨する金融、投資、トレード、その他のアドバイスや推奨を意図するものではなく、それらを構成するものでもありません。詳細は利用規約をご覧ください。
オープンソーススクリプト
TradingViewの精神に則り、このスクリプトの作者はコードをオープンソースとして公開してくれました。トレーダーが内容を確認・検証できるようにという配慮です。作者に拍手を送りましょう!無料で利用できますが、コードの再公開はハウスルールに従う必要があります。
免責事項
この情報および投稿は、TradingViewが提供または推奨する金融、投資、トレード、その他のアドバイスや推奨を意図するものではなく、それらを構成するものでもありません。詳細は利用規約をご覧ください。