OPEN-SOURCE SCRIPT
Polynomial Regression Slope [QTL]
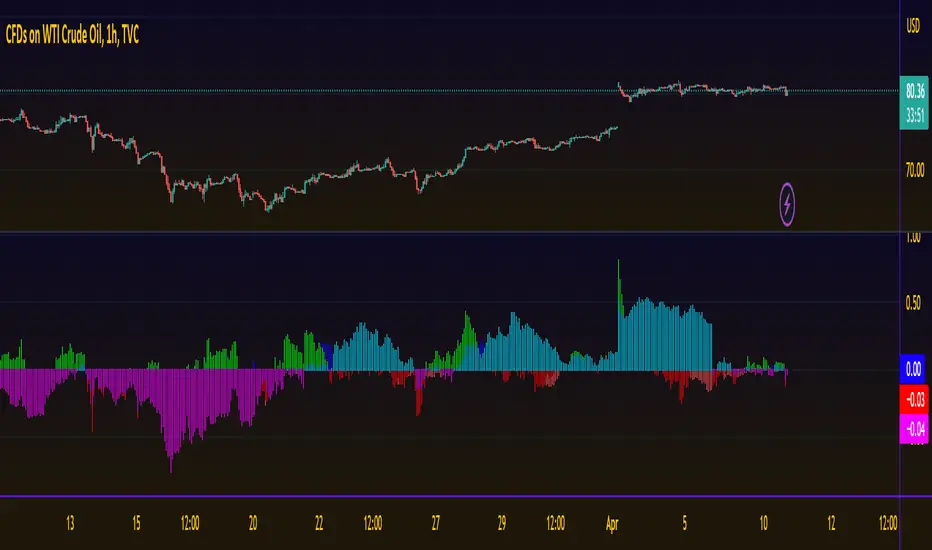
The Polynomial Regression Slope Indicator is a versatile and powerful tool for traders seeking to identify trends and potential entry or exit points in the market. By fitting a polynomial function to a dataset, this indicator can provide insights into the direction and strength of a trend over a specified time period. The indicator allows users to select the degree of the polynomial (1 for linear, 2 for quadratic, and 3 for cubic) to match their trading style and the characteristics of the market they are trading in.
While higher-degree polynomials can offer a better fit to the data, we recommend using a polynomial of degree less than 3 for the sake of stability and to avoid overfitting. Overfitting occurs when a model captures the noise in the data rather than the underlying trend, leading to false signals and decreased predictive power.
Slope is an important aspect of trading as it represents the rate of change of an asset's price over time. A positive slope indicates an upward trend, while a negative slope suggests a downward trend. By using the Polynomial Regression Slope Indicator, traders can better understand the current market dynamics, identify potential reversals or continuation patterns, and make informed decisions on when to enter or exit a position.
オープンソーススクリプト
TradingViewの精神に則り、このスクリプトの作者はコードをオープンソースとして公開してくれました。トレーダーが内容を確認・検証できるようにという配慮です。作者に拍手を送りましょう!無料で利用できますが、コードの再公開はハウスルールに従う必要があります。
免責事項
この情報および投稿は、TradingViewが提供または推奨する金融、投資、トレード、その他のアドバイスや推奨を意図するものではなく、それらを構成するものでもありません。詳細は利用規約をご覧ください。
オープンソーススクリプト
TradingViewの精神に則り、このスクリプトの作者はコードをオープンソースとして公開してくれました。トレーダーが内容を確認・検証できるようにという配慮です。作者に拍手を送りましょう!無料で利用できますが、コードの再公開はハウスルールに従う必要があります。
免責事項
この情報および投稿は、TradingViewが提供または推奨する金融、投資、トレード、その他のアドバイスや推奨を意図するものではなく、それらを構成するものでもありません。詳細は利用規約をご覧ください。