OPEN-SOURCE SCRIPT
ETS Prox Cumulative Volume Delta BB
This script is based on the work originally done by kprsa for the Monster Cumulative Delta indicator, but adds Bollinger Bands and upgrades it to version 4 from version 1.
It is an approximation of the Cumulative Delta Volume that is usually based on volume differences between market and limit orders, but because that data is not available, this indicator allocates a portion of the volume of a candle to the "upward" and "downward force" of each candle.
The upward force of a "Buy" candle is calculated by the High-Low
The downward force is calculated by (High-Close)+(Open-Low)
"Sell" candles are calculated in the same way just opposite
Total force=up force + down force
Up volume approximation = candle volume * up force/total force
Down volume approximation = candle volume * down force/total force
The result is similar to OBV, but not exactly the same, and allows for a "candle size" which you can't get with On Balance Volume.
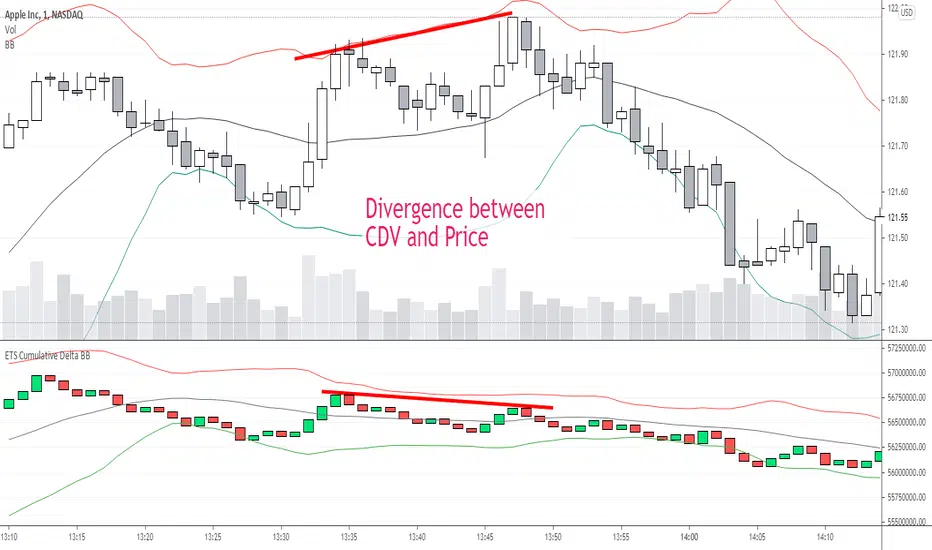
I had never used a Cumulative Delta Volume indicator before, but when I started using it myself, it proved very effective when there was a deviation from price. It was also very effective in my opinion when Bollinger Bands was added to assess the standard deviation of the CDV compared to the Bollinger Band of price and looking for areas where the CDV reaction to hitting or getting close to the BB was different.
I hope you find it useful! Of course, it comes with no guarantee of profits or any investing advice whatsoever.
It is an approximation of the Cumulative Delta Volume that is usually based on volume differences between market and limit orders, but because that data is not available, this indicator allocates a portion of the volume of a candle to the "upward" and "downward force" of each candle.
The upward force of a "Buy" candle is calculated by the High-Low
The downward force is calculated by (High-Close)+(Open-Low)
"Sell" candles are calculated in the same way just opposite
Total force=up force + down force
Up volume approximation = candle volume * up force/total force
Down volume approximation = candle volume * down force/total force
The result is similar to OBV, but not exactly the same, and allows for a "candle size" which you can't get with On Balance Volume.
I had never used a Cumulative Delta Volume indicator before, but when I started using it myself, it proved very effective when there was a deviation from price. It was also very effective in my opinion when Bollinger Bands was added to assess the standard deviation of the CDV compared to the Bollinger Band of price and looking for areas where the CDV reaction to hitting or getting close to the BB was different.
I hope you find it useful! Of course, it comes with no guarantee of profits or any investing advice whatsoever.
オープンソーススクリプト
TradingViewの精神に則り、このスクリプトの作者はコードをオープンソースとして公開してくれました。トレーダーが内容を確認・検証できるようにという配慮です。作者に拍手を送りましょう!無料で利用できますが、コードの再公開はハウスルールに従う必要があります。
Doing what I can to help people trade better. Past performance doesn't guarantee future results. Trade at your own risk. This is not financial advice, it is personal opinion, I'm not a financial adviser. I may have a stake in what I write about.
免責事項
この情報および投稿は、TradingViewが提供または推奨する金融、投資、トレード、その他のアドバイスや推奨を意図するものではなく、それらを構成するものでもありません。詳細は利用規約をご覧ください。