OPEN-SOURCE SCRIPT
Deviation Rate From Dynamic MA
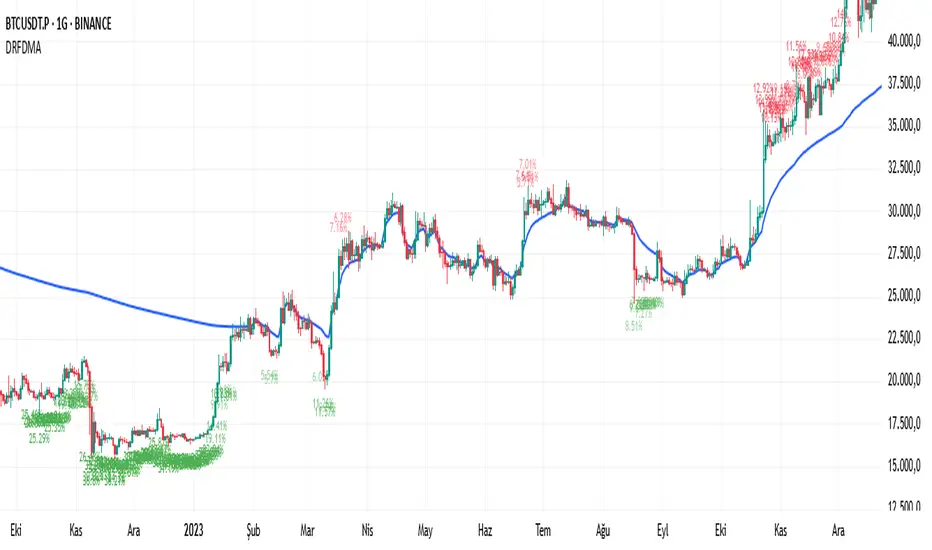
This indicator does the following; starting from the first bar (including the first bar) it calculates the average of the closings of the following bars, until the closing of a bar reaches the average. If the price has returned to the average, the starting bar for the average calculation is reset, that is, it starts calculating the average again from the bar where the return to the average (intersection) occurred.
If the deviation is greater than the entered percentage value (3% by default), it shows the deviation rate for each bar on the chart with a label. The color of the label text is shown as darker as the deviation rate increases, and more transparent as it decreases. You can change these settings according to your own preferences from the codes. You can create alarm conditions such as "If the deviation rate from the average is greater than x" to enter the transaction.
If the deviation is greater than the entered percentage value (3% by default), it shows the deviation rate for each bar on the chart with a label. The color of the label text is shown as darker as the deviation rate increases, and more transparent as it decreases. You can change these settings according to your own preferences from the codes. You can create alarm conditions such as "If the deviation rate from the average is greater than x" to enter the transaction.
オープンソーススクリプト
TradingViewの精神に則り、このスクリプトの作者はコードをオープンソースとして公開してくれました。トレーダーが内容を確認・検証できるようにという配慮です。作者に拍手を送りましょう!無料で利用できますが、コードの再公開はハウスルールに従う必要があります。
免責事項
この情報および投稿は、TradingViewが提供または推奨する金融、投資、トレード、その他のアドバイスや推奨を意図するものではなく、それらを構成するものでもありません。詳細は利用規約をご覧ください。
オープンソーススクリプト
TradingViewの精神に則り、このスクリプトの作者はコードをオープンソースとして公開してくれました。トレーダーが内容を確認・検証できるようにという配慮です。作者に拍手を送りましょう!無料で利用できますが、コードの再公開はハウスルールに従う必要があります。
免責事項
この情報および投稿は、TradingViewが提供または推奨する金融、投資、トレード、その他のアドバイスや推奨を意図するものではなく、それらを構成するものでもありません。詳細は利用規約をご覧ください。