OPEN-SOURCE SCRIPT
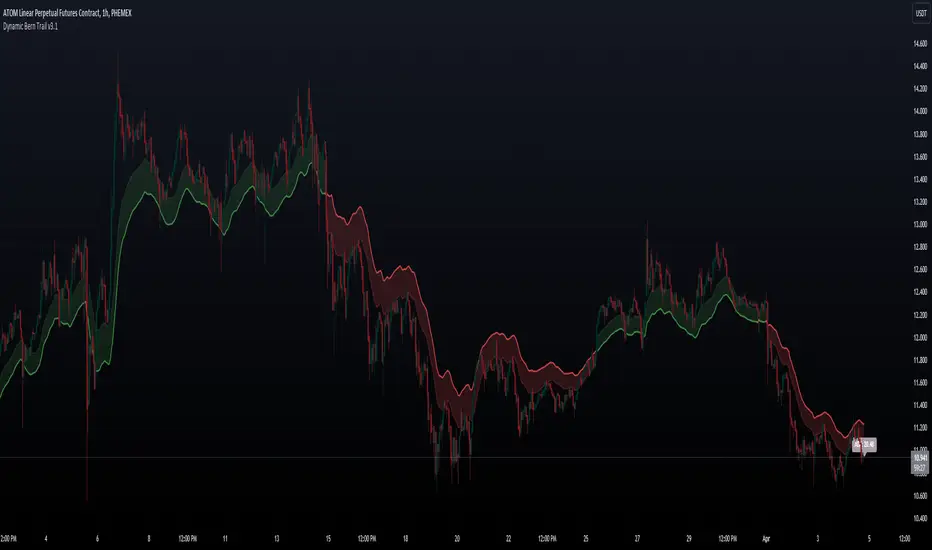
更新済 Dynamic Bern Trail

This indicator will help you following price movements in trending or ranging markets. Within it's calculations it uses ATR, EMA with a smoothing effect. It includes a buffer zone to help determine where price may turn around and reverse or to identify when a breakout occurs by breaking through the ATR trail. You can customize and play around with several settings to adjust it for your asset. Adjustments that can be made besides visuals are ATR Length, ATR Multiplier, EMA Length, Smoothing Length and the Buffer Multiplier.
リリースノート
Multi-timeframe added. Also you can now choose between EMA, SMA, RMA, HMA, DEMA and TMA for the main plot. When first created only the EMA was used, so you might have to change some of the other settings when choosing your desired Moving average.リリースノート
Added a current "ADX" label level reading. It will update with each new bar that is produced. (So be careful on higher timeframes) 50 and above is Blue = "Really strong trend"
50 - 25 is Purple = "Strong trend"
25 - 20 is Gray = "Neutral" Keep an eye out.
20 and Below is Red =" Weak or no trend"
Note: Please remember the ADX does not keep trend direction in mind, you can have a high reading of 50 and price is decreasing. Meaning its a strong trend to the downside.
You can switch the ADX label On/Off.
リリースノート
Clean code.リリースノート
Typo fixed.リリースノート
Added VWMA and WMA to the MA Type options.オープンソーススクリプト
TradingViewの精神に則り、このスクリプトの作者はコードをオープンソースとして公開してくれました。トレーダーが内容を確認・検証できるようにという配慮です。作者に拍手を送りましょう!無料で利用できますが、コードの再公開はハウスルールに従う必要があります。
免責事項
この情報および投稿は、TradingViewが提供または推奨する金融、投資、トレード、その他のアドバイスや推奨を意図するものではなく、それらを構成するものでもありません。詳細は利用規約をご覧ください。
オープンソーススクリプト
TradingViewの精神に則り、このスクリプトの作者はコードをオープンソースとして公開してくれました。トレーダーが内容を確認・検証できるようにという配慮です。作者に拍手を送りましょう!無料で利用できますが、コードの再公開はハウスルールに従う必要があります。
免責事項
この情報および投稿は、TradingViewが提供または推奨する金融、投資、トレード、その他のアドバイスや推奨を意図するものではなく、それらを構成するものでもありません。詳細は利用規約をご覧ください。