OPEN-SOURCE SCRIPT
MA Rainbow-AYNET
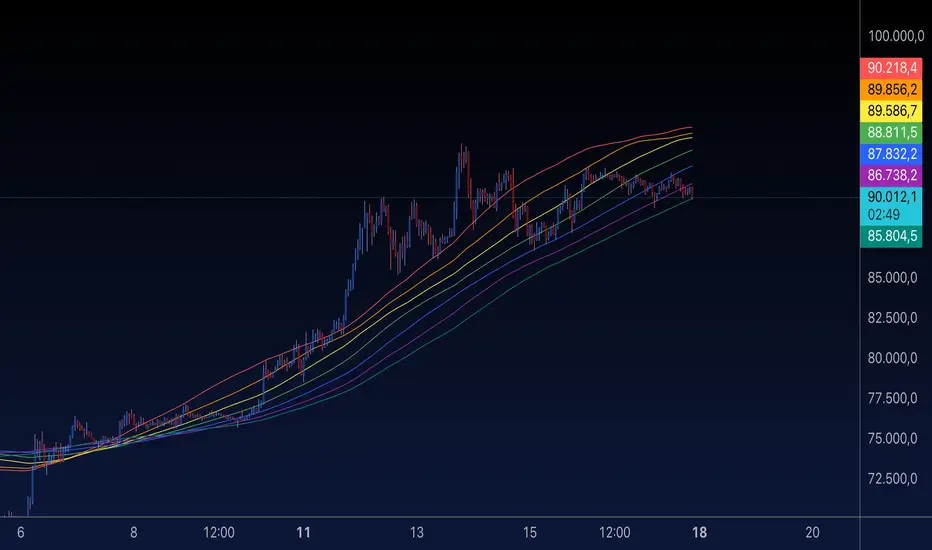
Summary of the "MA Rainbow"
The 200 MA Rainbow script creates a visually appealing representation of multiple moving averages (MAs) with varying lengths and colors to provide insights into price trends and market momentum.
Key Features:
Base Moving Average:
A starting point (ma_length, default 200) is used as the foundation for all other bands.
Rainbow Bands:
The script generates multiple moving averages (bands) with increasing lengths, spaced by a user-defined band_spacing multiplier.
The number of bands is controlled by rainbow_bands, allowing up to 7 bands.
Moving Average Types:
Users can select the MA type: Simple (SMA), Exponential (EMA), or Weighted (WMA).
Dynamic Colors:
Each band is assigned a unique color from a predefined rainbow palette, making the chart visually distinct.
Inputs for Customization:
ma_length: Adjust the base period of the moving average.
rainbow_bands: Set the number of bands to display.
band_spacing: Control the spread between bands.
How It Works:
Precomputing Bands:
Each band’s length is calculated based on the base length (ma_length) and a multiplier (band_spacing).
For example, if ma_length = 200 and band_spacing = 0.2, the lengths of the first 3 bands will be:
Band 1: 200
Band 2: 240
Band 3: 280
Global Plotting:
Each band’s moving average is precomputed using the selected type (SMA, EMA, or WMA).
Bands are plotted globally to avoid scope issues, ensuring compatibility with Pine Script rules.
Color Cycling:
Colors are assigned dynamically from a rainbow palette (red, orange, yellow, green, blue, purple, teal).
Use Case:
The 200 MA Rainbow helps traders:
Visualize market trends with multiple layers of moving averages.
Identify areas of support and resistance.
Gauge momentum through the spread and alignment of bands.
Customization:
Users can:
Change the base moving average length (ma_length).
Adjust the number of bands (rainbow_bands).
Control the spread between bands with band_spacing.
Select the moving average type (SMA, EMA, WMA).
Application:
Copy the script into the Pine Editor in TradingView.
Apply it to your chart to observe the Rainbow MA visualization.
Adjust inputs to match your trading style or strategy.
This script is a versatile tool for both beginner and advanced traders, providing a colorful way to track price trends and market conditions. 🌈
オープンソーススクリプト
TradingViewの精神に則り、このスクリプトの作者はコードをオープンソースとして公開してくれました。トレーダーが内容を確認・検証できるようにという配慮です。作者に拍手を送りましょう!無料で利用できますが、コードの再公開はハウスルールに従う必要があります。
免責事項
この情報および投稿は、TradingViewが提供または推奨する金融、投資、トレード、その他のアドバイスや推奨を意図するものではなく、それらを構成するものでもありません。詳細は利用規約をご覧ください。
オープンソーススクリプト
TradingViewの精神に則り、このスクリプトの作者はコードをオープンソースとして公開してくれました。トレーダーが内容を確認・検証できるようにという配慮です。作者に拍手を送りましょう!無料で利用できますが、コードの再公開はハウスルールに従う必要があります。
免責事項
この情報および投稿は、TradingViewが提供または推奨する金融、投資、トレード、その他のアドバイスや推奨を意図するものではなく、それらを構成するものでもありません。詳細は利用規約をご覧ください。