OPEN-SOURCE SCRIPT
PriorRange v0.3 [OmarxQQQ/dc_77]
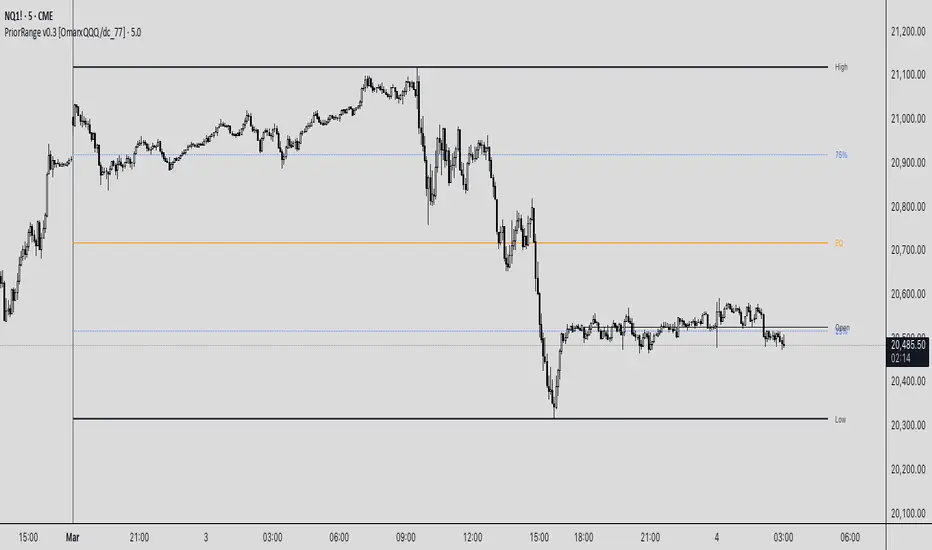
PriorRangeLevels is a versatile indicator that plots key price levels based on prior period ranges across multiple timeframes. This tool helps traders identify potential support, resistance, and breakout zones by displaying the High, Low, 75%, 50% (EQ), and 25% levels from the previous period.
Key Features:
- Multi-timeframe analysis from 1-minute to Monthly charts
- Time zone flexibility with options for major global markets (NYC, London, Tokyo, etc.)
- Customizable display for each level (High, Low, 75%, EQ, 25%, Open)
- Clean, organized settings interface with grouped options
- Anchor line marking the start of prior periods
- Current period open price reference
How It Works:
The indicator detects new periods based on your selected timeframe and calculates the range of the previous period. It then plots horizontal lines at the High, Low, and three internal levels (75%, 50%, 25%) extending forward by your specified number of bars. These levels serve as potential support/resistance zones and decision points for your trading strategy.
Trading Applications:
- Use High/Low levels as potential breakout targets or reversal zones
- Monitor price reaction to the EQ (50%) level to gauge trend strength
- Identify intraday support/resistance based on previous period ranges
- Plan entries and exits around established market structure
Each component can be individually customized with different line styles, colors, and widths to match your chart preferences and analytical needs.
Originally created by dc_77 with enhanced organization, multi-timeframe capabilities, and improved user interface. As Requested by many people.
populi a populo pro populo
GLGT
オープンソーススクリプト
TradingViewの精神に則り、このスクリプトの作者はコードをオープンソースとして公開してくれました。トレーダーが内容を確認・検証できるようにという配慮です。作者に拍手を送りましょう!無料で利用できますが、コードの再公開はハウスルールに従う必要があります。
Making haste Slowly
免責事項
この情報および投稿は、TradingViewが提供または推奨する金融、投資、トレード、その他のアドバイスや推奨を意図するものではなく、それらを構成するものでもありません。詳細は利用規約をご覧ください。
オープンソーススクリプト
TradingViewの精神に則り、このスクリプトの作者はコードをオープンソースとして公開してくれました。トレーダーが内容を確認・検証できるようにという配慮です。作者に拍手を送りましょう!無料で利用できますが、コードの再公開はハウスルールに従う必要があります。
Making haste Slowly
免責事項
この情報および投稿は、TradingViewが提供または推奨する金融、投資、トレード、その他のアドバイスや推奨を意図するものではなく、それらを構成するものでもありません。詳細は利用規約をご覧ください。