OPEN-SOURCE SCRIPT
更新済 Combined Candle Counter
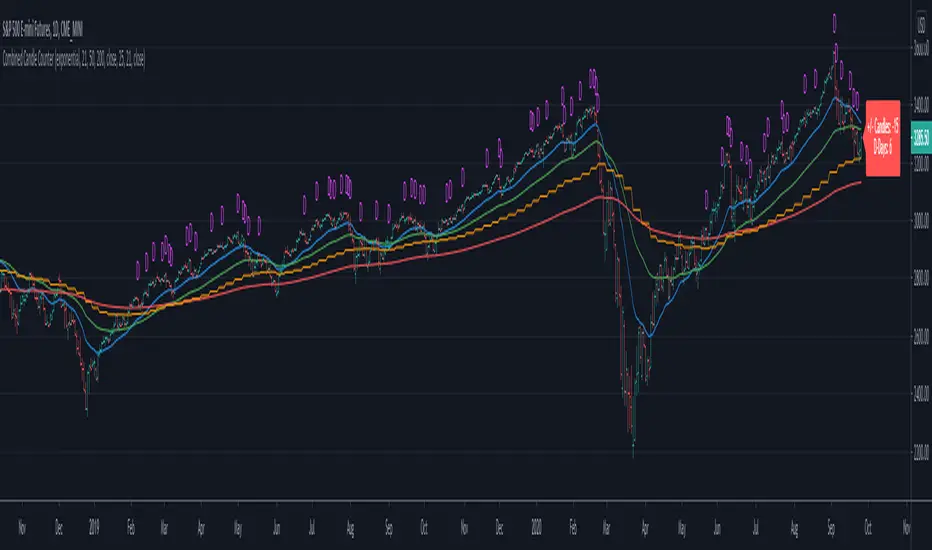
This script combines multiple indicators and count their results in a label
- Shows the weekly moving average in a daily chart
- Count the days where the underlying is above & below the moving average and shows the figure in a label
- Shows & Count Distribution days in relation to the weekly moving average
- Daily / Weekly Moving Averages can be configured (length, type, reference)
リリースノート
Update to avoid repaintingリリースノート
minor bugfixリリースノート
Added two additional moving averages (default MA 50 and MA 200)オープンソーススクリプト
TradingViewの精神に則り、このスクリプトの作者はコードをオープンソースとして公開してくれました。トレーダーが内容を確認・検証できるようにという配慮です。作者に拍手を送りましょう!無料で利用できますが、コードの再公開はハウスルールに従う必要があります。
免責事項
この情報および投稿は、TradingViewが提供または推奨する金融、投資、トレード、その他のアドバイスや推奨を意図するものではなく、それらを構成するものでもありません。詳細は利用規約をご覧ください。
オープンソーススクリプト
TradingViewの精神に則り、このスクリプトの作者はコードをオープンソースとして公開してくれました。トレーダーが内容を確認・検証できるようにという配慮です。作者に拍手を送りましょう!無料で利用できますが、コードの再公開はハウスルールに従う必要があります。
免責事項
この情報および投稿は、TradingViewが提供または推奨する金融、投資、トレード、その他のアドバイスや推奨を意図するものではなく、それらを構成するものでもありません。詳細は利用規約をご覧ください。