OPEN-SOURCE SCRIPT
Adaptive and Static Relative Strength Overlay
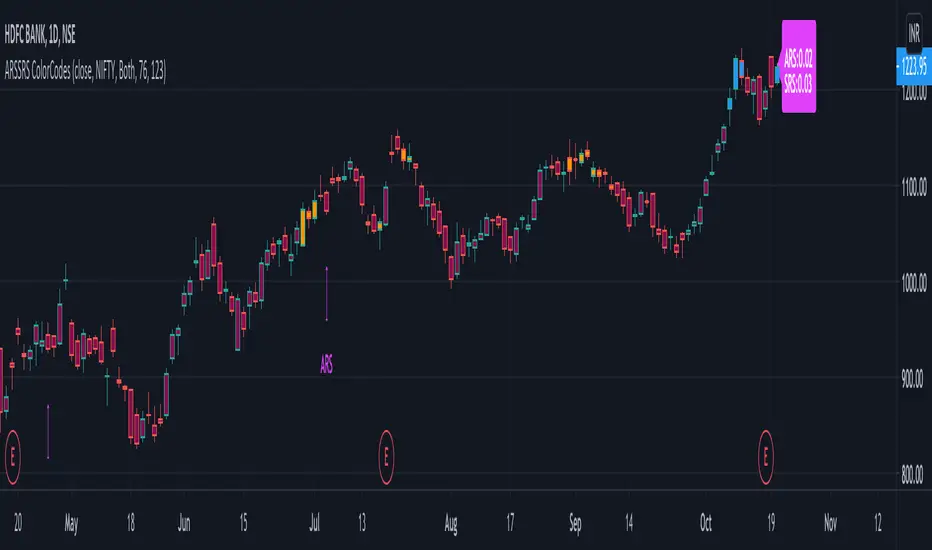
This indictor combines adaptive and static relative strengths and displays the strength in a unique colour coding on the bars.
With this the one can view the performance of both the relative strengths in one indicator and overlay-ed on the price chart.
Adaptive Relative Strength - Date is identified based on market scenarios. It will change based on how the market trends in the future.
Static Relative Strength - Date is fixed (123 sessions). Roughly corresponds to 6 months.
The (default) colour coding is:
If "Both" is selected:
ars > 0 and srs > 0 = Blue
ars <=0 and srs <= 0 = Maroon
Orange otherwise (Any of ars or srs is negative)
If "Only ARS" is selected:
ars > 0 = Blue
Maroon otherwise
If "Only SRS" is selected:
srs > 0 = Blue
Maroon otherwise
Additionally the ARS and the SRS will be marked as labels on the bars corresponding to the reference dates.
The current ARS and SRS values will be market as label on the last bar.
Source can be any valid source, close is selected by default.
Default benchmark is "Nifty 50" the NSE Indian benchmark. This can be changed.
オープンソーススクリプト
TradingViewの精神に則り、このスクリプトの作者はコードをオープンソースとして公開してくれました。トレーダーが内容を確認・検証できるようにという配慮です。作者に拍手を送りましょう!無料で利用できますが、コードの再公開はハウスルールに従う必要があります。
免責事項
この情報および投稿は、TradingViewが提供または推奨する金融、投資、トレード、その他のアドバイスや推奨を意図するものではなく、それらを構成するものでもありません。詳細は利用規約をご覧ください。
オープンソーススクリプト
TradingViewの精神に則り、このスクリプトの作者はコードをオープンソースとして公開してくれました。トレーダーが内容を確認・検証できるようにという配慮です。作者に拍手を送りましょう!無料で利用できますが、コードの再公開はハウスルールに従う必要があります。
免責事項
この情報および投稿は、TradingViewが提供または推奨する金融、投資、トレード、その他のアドバイスや推奨を意図するものではなく、それらを構成するものでもありません。詳細は利用規約をご覧ください。