OPEN-SOURCE SCRIPT
BIST30 % Above Moving Average (Breadth)
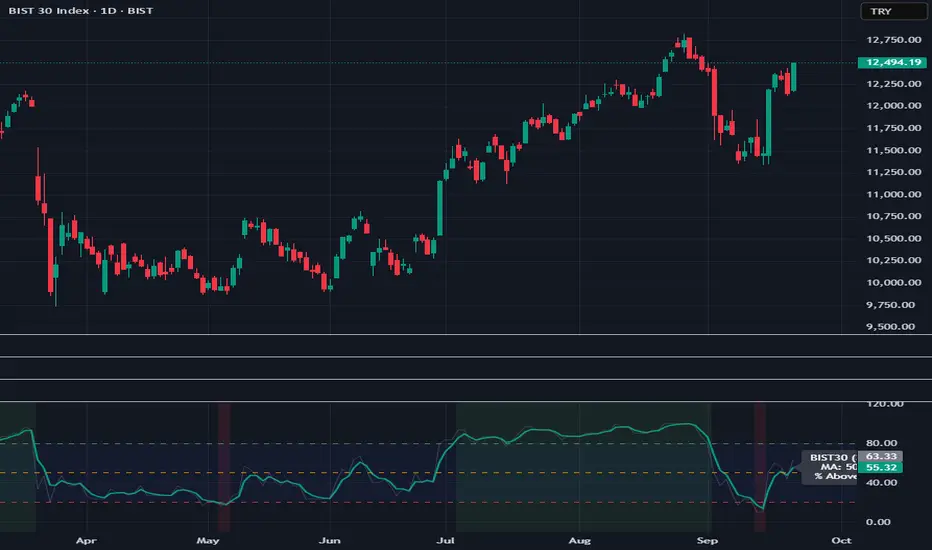
BIST30 % Above Moving Average (Breadth)
This indicator shows the percentage of BIST30 stocks trading above a selected moving average.
It is a market breadth tool, designed to measure the overall health and participation of the market.
How it works
By default, it uses the 50-day SMA.
You can switch between SMA/EMA and choose different periods (5 / 20 / 50 / 200).
The script checks each BIST30 stock individually and counts how many are closing above the chosen MA.
Interpretation
Above 80% → Overbought zone (short-term correction likely).
Below 20% → Oversold zone (potential rebound).
Around 50% → Neutral / indecisive market.
If the index (BIST:XU030) rises while this indicator falls → the rally is narrow-based, led by only a few stocks (a warning sign).
Use cases
Short-term traders → Use MA=5 or 20 for momentum signals.
Swing / Medium-term investors → Use MA=50 for market health.
Long-term investors → Use MA=200 to track bull/bear market cycles.
Notes
This script covers only BIST30 stocks by default.
The list can be updated for BIST100 or specific sectors (e.g., banks, industrials).
Breadth indicators should not be used as standalone buy/sell signals — combine them with price action, volume, and other technical tools for confirmation.
オープンソーススクリプト
TradingViewの精神に則り、このスクリプトの作者はコードをオープンソースとして公開してくれました。トレーダーが内容を確認・検証できるようにという配慮です。作者に拍手を送りましょう!無料で利用できますが、コードの再公開はハウスルールに従う必要があります。
免責事項
この情報および投稿は、TradingViewが提供または推奨する金融、投資、トレード、その他のアドバイスや推奨を意図するものではなく、それらを構成するものでもありません。詳細は利用規約をご覧ください。
オープンソーススクリプト
TradingViewの精神に則り、このスクリプトの作者はコードをオープンソースとして公開してくれました。トレーダーが内容を確認・検証できるようにという配慮です。作者に拍手を送りましょう!無料で利用できますが、コードの再公開はハウスルールに従う必要があります。
免責事項
この情報および投稿は、TradingViewが提供または推奨する金融、投資、トレード、その他のアドバイスや推奨を意図するものではなく、それらを構成するものでもありません。詳細は利用規約をご覧ください。