Hello everyone <3
I present to you guys my new indicator Volume per Point (VP)
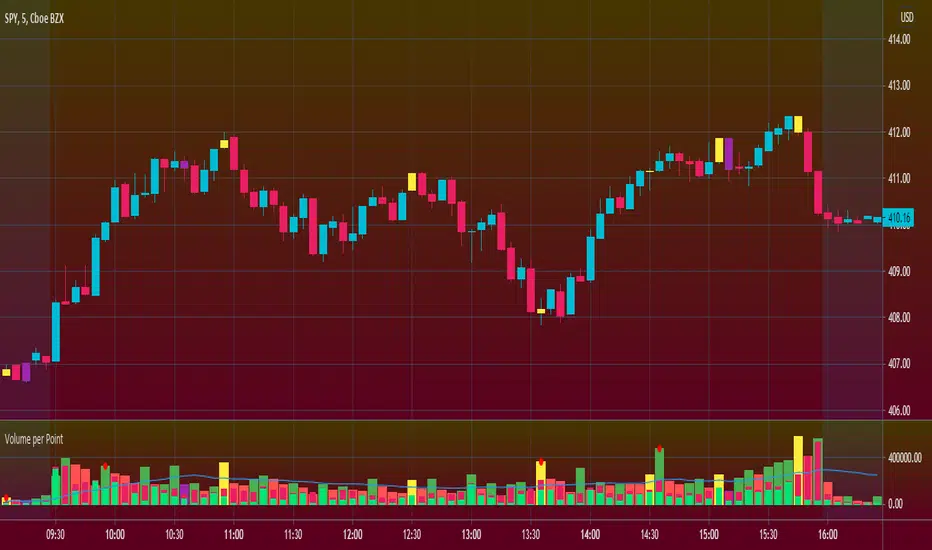
As suggested by the title, this script gives you the volume for every point.
Here's a run down on specific features:
SUBCHART COLUMNS:
The columns can be the following four colors:
Green - There was an increase in VP
Red - There was a decrease in VP
Yellow - There was divergence between volume and candle range
Purple - There are signs of exhaustion compared to the previous candlestick
SUBCHART HISTOGRAM:
The histogram can be the following two colors:
Lime - Buying volume
Red - Selling volume
I left you guys the ability to change the multiplier on the volume in settings just incase it's too small or too big compared to the VP. Decimals are allowed!
CANDLESTICK CHART:
The candlesticks can the following two colors:
Yellow - There was a divergence between volume and candle range
Purple - There are signs of exhaustion compared to the previous candlestick
FILTERS
In the settings, you're able to add the following two filters:
RSI Filters - RSI must be below or above the specified value for the divergence or exhaustion to trigger
Percent Filters - The candlestick range or volume must be higher or lower than the specified value depending whether it's divergence or exhaustion.
This is a very helpful tool if you're interesting in reading volume. It also facilitates finding market maker activity depending on the size of the VP. Sudden abnormal spikes in VP usually do signal something and that's up for you to figure out :)
Thank you for your time to read this
~July <3
I present to you guys my new indicator Volume per Point (VP)
As suggested by the title, this script gives you the volume for every point.
Here's a run down on specific features:
SUBCHART COLUMNS:
The columns can be the following four colors:
Green - There was an increase in VP
Red - There was a decrease in VP
Yellow - There was divergence between volume and candle range
Purple - There are signs of exhaustion compared to the previous candlestick
SUBCHART HISTOGRAM:
The histogram can be the following two colors:
Lime - Buying volume
Red - Selling volume
I left you guys the ability to change the multiplier on the volume in settings just incase it's too small or too big compared to the VP. Decimals are allowed!
CANDLESTICK CHART:
The candlesticks can the following two colors:
Yellow - There was a divergence between volume and candle range
Purple - There are signs of exhaustion compared to the previous candlestick
FILTERS
In the settings, you're able to add the following two filters:
RSI Filters - RSI must be below or above the specified value for the divergence or exhaustion to trigger
Percent Filters - The candlestick range or volume must be higher or lower than the specified value depending whether it's divergence or exhaustion.
This is a very helpful tool if you're interesting in reading volume. It also facilitates finding market maker activity depending on the size of the VP. Sudden abnormal spikes in VP usually do signal something and that's up for you to figure out :)
Thank you for your time to read this
~July <3
リリースノート
Changes:- By default, volume is now disabled
- Now adds a red dot to the subchart column if there it detects an abnormal spike
You can re-enable volume and change the tolerance level for abnormal spikes via the "Multipliers" section in the settings :)
オープンソーススクリプト
TradingViewの精神に則り、このスクリプトの作者はコードをオープンソースとして公開してくれました。トレーダーが内容を確認・検証できるようにという配慮です。作者に拍手を送りましょう!無料で利用できますが、コードの再公開はハウスルールに従う必要があります。
免責事項
この情報および投稿は、TradingViewが提供または推奨する金融、投資、トレード、その他のアドバイスや推奨を意図するものではなく、それらを構成するものでもありません。詳細は利用規約をご覧ください。
オープンソーススクリプト
TradingViewの精神に則り、このスクリプトの作者はコードをオープンソースとして公開してくれました。トレーダーが内容を確認・検証できるようにという配慮です。作者に拍手を送りましょう!無料で利用できますが、コードの再公開はハウスルールに従う必要があります。
免責事項
この情報および投稿は、TradingViewが提供または推奨する金融、投資、トレード、その他のアドバイスや推奨を意図するものではなく、それらを構成するものでもありません。詳細は利用規約をご覧ください。