INVITE-ONLY SCRIPT
更新済 ES Bundle
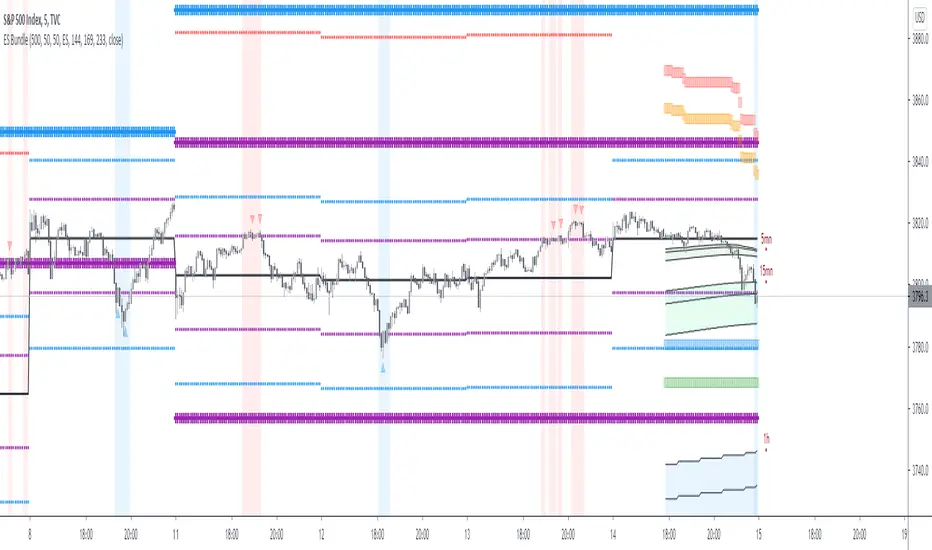
This script is for ES ( E Mini futur or MES) day trading only.
It is a simulation of marker behavior resulting in 2 kind of level:
Oversold and overbougth level:
* It is square shape: orange and red are 1st and 2nd level of Overbougth ( high probability to down of 16 points if you have a bearish divergence of momemtum above these levels)
* It is square shape:blue and green are 1st and 2nd level of Overbougth ( high probability to upof 16 points if you have a bullish divergence of momemtum above these levels)
*In case of crazy market rend (10% of the time, only small reversal is expected but more often than not momemtum will not plot divergence)
Level of support and resistance
*There is 2 size ( cross shaped pattern), the small is for daily timeframe and the large is for weekly timeframe
*Purple line is the fiest and weakest area of resistance or support
*Blue cross is and interesting level, if momemtum plot divergence above blue resistance or below bull support it is time to search for short or long respectivly
*Red line is when crazy market happen, every divergence above or below red line is a major trade reversal
Obviously if you are on support level + under oversold zone it is the best setup to long and vice versa
リリースノート
Update :*Adding Bundle for GC, CL, SPX, BTC and VIX
* Adding FIlter for signal ( red and blue triangle)
*All signal must be filtered by divergence on momemtum reader (see indicator on tradingview)
招待専用スクリプト
このスクリプトは作者が承認したユーザーのみアクセス可能です。使用するにはアクセス申請をして許可を得る必要があります。通常は支払い後に承認されます。詳細は下記の作者の指示に従うか、nonobdxに直接お問い合わせください。
TradingViewは、作者を完全に信頼し、スクリプトの動作を理解していない限り、有料スクリプトの購入・使用を推奨しません。コミュニティスクリプトには無料のオープンソースの代替が多数あります。
作者の指示
Apprendre la méthode:
discord.gg/b7YGtY2
Site internet: marketreader.fr/
Chaine Youtube : youtube.com/channel/UC-a7p8DkfbDM6ONrTzsaErA?view_as=subscriber
discord.gg/b7YGtY2
Site internet: marketreader.fr/
Chaine Youtube : youtube.com/channel/UC-a7p8DkfbDM6ONrTzsaErA?view_as=subscriber
免責事項
この情報および投稿は、TradingViewが提供または推奨する金融、投資、トレード、その他のアドバイスや推奨を意図するものではなく、それらを構成するものでもありません。詳細は利用規約をご覧ください。