OPEN-SOURCE SCRIPT
RSI+Bollinger Bands
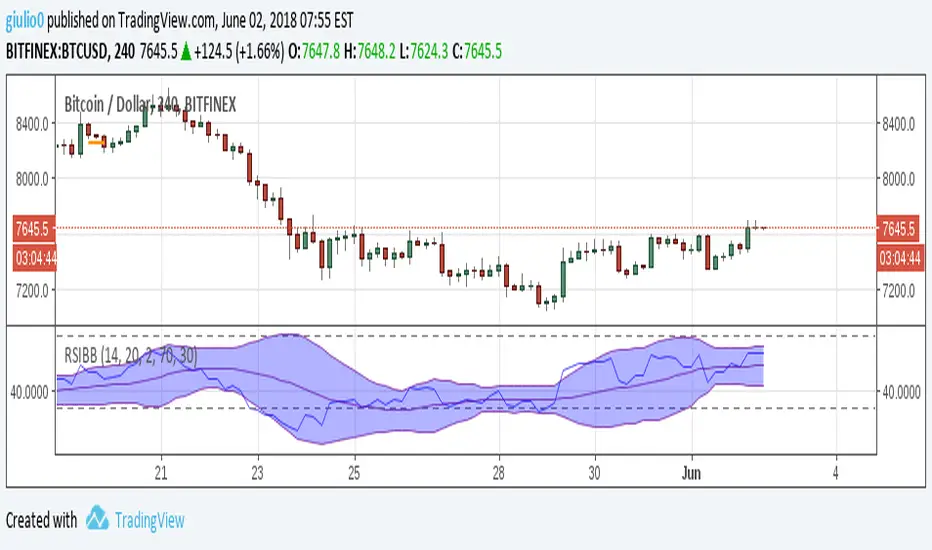
This is a simple RSI with applied Bollinger Bands. The BB may help spotting "hidden" divergences or "fake" divergences. For instance: in an uptrend we have a high followed by a higher high, the plain RSI shows a divergence, adding BB we see that the first (higher) RSI high is inside the BB, while the second (lower) RSI high is outside the bands, this would be a fake divergence.
The use of the indicator should be straightforward, for any questions feel free to write me a message
The use of the indicator should be straightforward, for any questions feel free to write me a message
オープンソーススクリプト
TradingViewの精神に則り、このスクリプトの作者はコードをオープンソースとして公開してくれました。トレーダーが内容を確認・検証できるようにという配慮です。作者に拍手を送りましょう!無料で利用できますが、コードの再公開はハウスルールに従う必要があります。
免責事項
この情報および投稿は、TradingViewが提供または推奨する金融、投資、トレード、その他のアドバイスや推奨を意図するものではなく、それらを構成するものでもありません。詳細は利用規約をご覧ください。
オープンソーススクリプト
TradingViewの精神に則り、このスクリプトの作者はコードをオープンソースとして公開してくれました。トレーダーが内容を確認・検証できるようにという配慮です。作者に拍手を送りましょう!無料で利用できますが、コードの再公開はハウスルールに従う必要があります。
免責事項
この情報および投稿は、TradingViewが提供または推奨する金融、投資、トレード、その他のアドバイスや推奨を意図するものではなく、それらを構成するものでもありません。詳細は利用規約をご覧ください。