OPEN-SOURCE SCRIPT
M2 Global Liquidity Index [Custom Offsets]
M2 Global Liquidity Index [Custom Offsets]
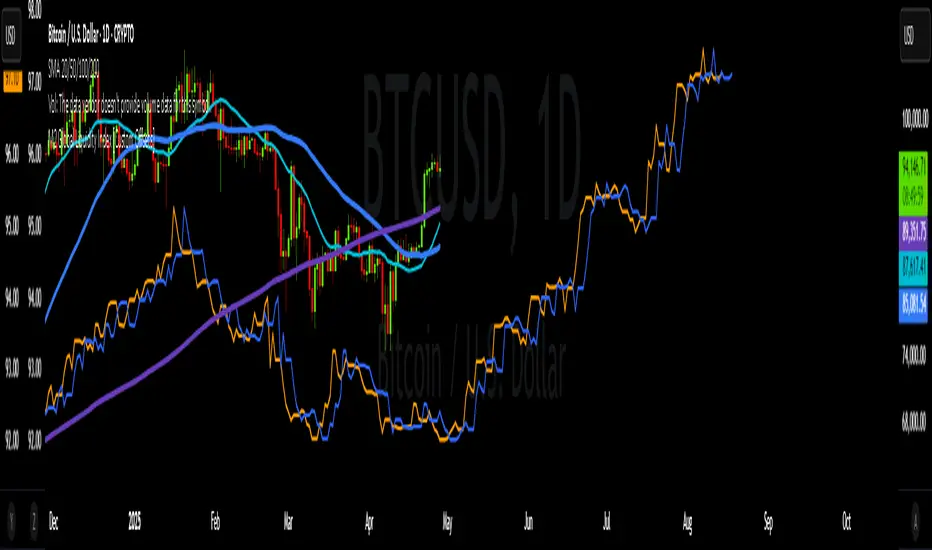
Plots the global M2 money supply alongside price, with two user-configurable forward shifts to help you anticipate macro-driven moves in BTC (or any asset).
Key Features
Current M2 Index (no offset)
Offset A — shift M2 forward by N days (default 78)
Offset B — shift M2 forward by M days (default 109)
Extended Currencies toggle adds 9 additional central banks (CHF, CAD, INR, RUB, BRL, KRW, MXN, ZAR)
All lines share the left-hand axis and scale to trillions
Inputs
Offset A (days): integer ≥ 0 (default 78)
Offset B (days): integer ≥ 0 (default 109)
Include extended currencies?: on/off
How to Use
Add the indicator to any chart (overlay mode).
In Settings → Inputs, enter your desired lead times for Offset A and Offset B.
Toggle extended currencies if you need a broader “global liquidity” view.
Watch how price action (e.g. BTC) tracks the shifted M2 lines to spot potential turning points.
Why It Matters
Changes in money supply often lead risk assets by several weeks to months. This tool makes it easy to visualize and test those correlations directly on your favorite timeframe.
オープンソーススクリプト
TradingViewの精神に則り、このスクリプトの作者はコードをオープンソースとして公開してくれました。トレーダーが内容を確認・検証できるようにという配慮です。作者に拍手を送りましょう!無料で利用できますが、コードの再公開はハウスルールに従う必要があります。
免責事項
この情報および投稿は、TradingViewが提供または推奨する金融、投資、トレード、その他のアドバイスや推奨を意図するものではなく、それらを構成するものでもありません。詳細は利用規約をご覧ください。
オープンソーススクリプト
TradingViewの精神に則り、このスクリプトの作者はコードをオープンソースとして公開してくれました。トレーダーが内容を確認・検証できるようにという配慮です。作者に拍手を送りましょう!無料で利用できますが、コードの再公開はハウスルールに従う必要があります。
免責事項
この情報および投稿は、TradingViewが提供または推奨する金融、投資、トレード、その他のアドバイスや推奨を意図するものではなく、それらを構成するものでもありません。詳細は利用規約をご覧ください。