OPEN-SOURCE SCRIPT
更新済 BBD Master
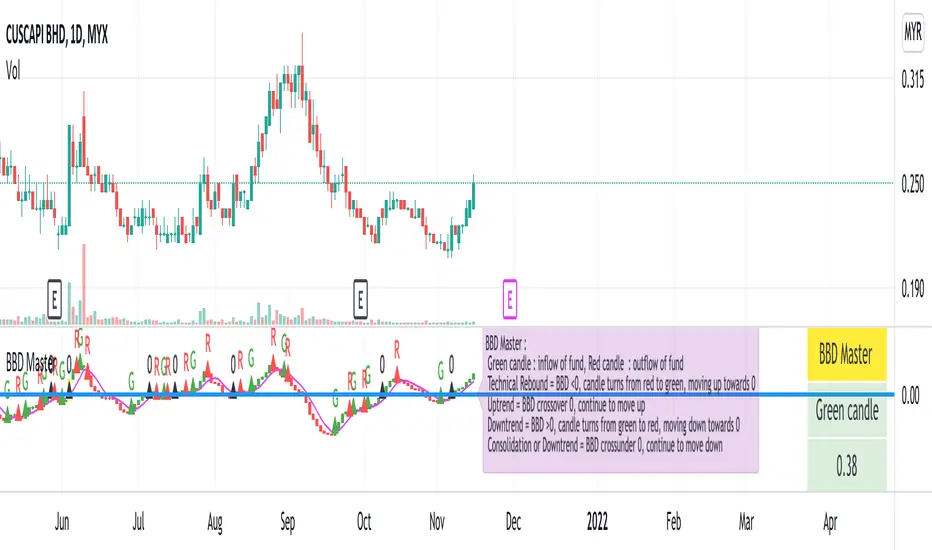
BBD Master :
An indicator attempts to simulate the net deviation of big buy (or inflow of fund) and big sell (or outflow of fund) of a stocks.
Regardless of BBD values, green candle means an inflow of fund resulting in net buy while red candle means an outflow of fund resulting in net sell.
It can be used for trend analysis.
When BBD is below 0 , BBD candle turns from red to green, and continue moving up towards 0, a potential sign of technical rebound.
When BBD crossover 0, and continue to move up, stocks may develop into an uptrend.
Open & Close, typically, will be above 20-day moving average.
When BBD is above 0, BBD candle turns from green to red, and continue moving down towards 0, stocks may develop into a downtrend, or at times, showing a top deviation where stocks price continue to move up while BBD moving down.
When BBD crossunder 0, and continue moving down, stocks may develop in a bearish trend or consolidation.
BBD Master, can be used together with chips master, trend master and MCDX Plus or indicators that users see fit, for better trend analysis.
Input/Comments are welcome to help improve the scripts, and may benefit users in long run. Hope this help.
Disclaimer : stocks used is meant to illustrate the indicator, no recommendation of buy/sell.
リリースノート
revision 2, added source input, candle turn green/turn red alerts and indicator descriptions. (Disclaimer : charted used is for illustration purpose only)オープンソーススクリプト
TradingViewの精神に則り、このスクリプトの作者はコードをオープンソースとして公開してくれました。トレーダーが内容を確認・検証できるようにという配慮です。作者に拍手を送りましょう!無料で利用できますが、コードの再公開はハウスルールに従う必要があります。
免責事項
この情報および投稿は、TradingViewが提供または推奨する金融、投資、トレード、その他のアドバイスや推奨を意図するものではなく、それらを構成するものでもありません。詳細は利用規約をご覧ください。
オープンソーススクリプト
TradingViewの精神に則り、このスクリプトの作者はコードをオープンソースとして公開してくれました。トレーダーが内容を確認・検証できるようにという配慮です。作者に拍手を送りましょう!無料で利用できますが、コードの再公開はハウスルールに従う必要があります。
免責事項
この情報および投稿は、TradingViewが提供または推奨する金融、投資、トレード、その他のアドバイスや推奨を意図するものではなく、それらを構成するものでもありません。詳細は利用規約をご覧ください。