OPEN-SOURCE SCRIPT
更新済 US 20Y Treasury Yield
What This Indicator Does
This Pine Script creates a custom indicator for TradingView that displays the US 20-Year Treasury Yield (US20Y) on your chart. Here's what it does step by step:
1. What Is the US 20-Year Treasury Yield?
The US 20-Year Treasury Yield is a financial metric that shows the interest rate (or yield) investors earn when they buy US government bonds that mature in 20 years. It’s an important indicator of the economy and can influence other markets like stocks, bonds, and currencies.
2. How Does the Indicator Work?
The indicator fetches the latest data for the US 20-Year Treasury Yield from TradingView's database.
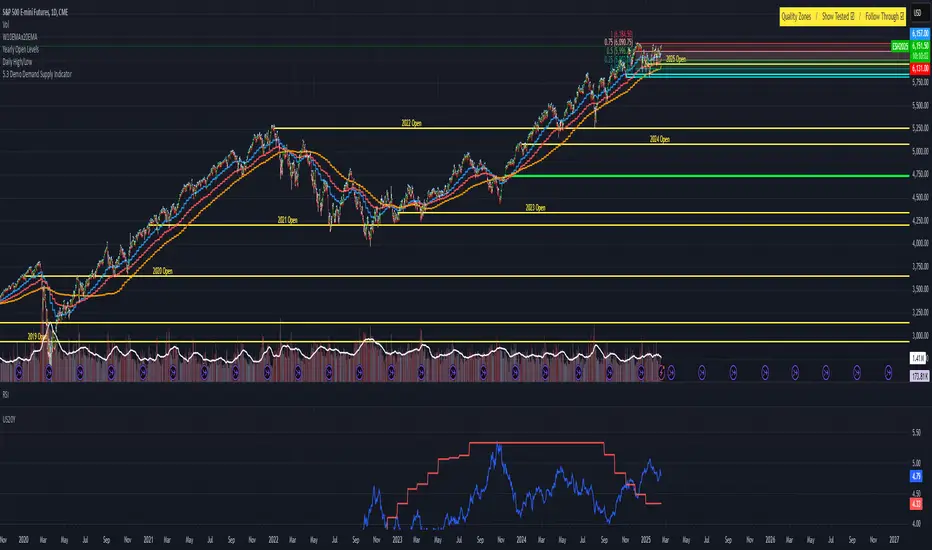
It then plots this data in a separate pane below your main chart, so you can easily monitor the yield without cluttering your price chart.
3. What Does the Indicator Show?
A blue line is drawn in the separate pane, showing the movement of the US 20-Year Treasury Yield over time.
A gray dashed line is added at the 4.0% level as a reference point. You can use this line to quickly see when the yield is above or below 4.0%.
5. Why Use This Indicator?
Monitor Economic Trends : The US 20-Year Treasury Yield is a key economic indicator. By plotting it on your chart, you can stay informed about changes in interest rates and their potential impact on other markets.
This Pine Script creates a custom indicator for TradingView that displays the US 20-Year Treasury Yield (US20Y) on your chart. Here's what it does step by step:
1. What Is the US 20-Year Treasury Yield?
The US 20-Year Treasury Yield is a financial metric that shows the interest rate (or yield) investors earn when they buy US government bonds that mature in 20 years. It’s an important indicator of the economy and can influence other markets like stocks, bonds, and currencies.
2. How Does the Indicator Work?
The indicator fetches the latest data for the US 20-Year Treasury Yield from TradingView's database.
It then plots this data in a separate pane below your main chart, so you can easily monitor the yield without cluttering your price chart.
3. What Does the Indicator Show?
A blue line is drawn in the separate pane, showing the movement of the US 20-Year Treasury Yield over time.
A gray dashed line is added at the 4.0% level as a reference point. You can use this line to quickly see when the yield is above or below 4.0%.
5. Why Use This Indicator?
Monitor Economic Trends : The US 20-Year Treasury Yield is a key economic indicator. By plotting it on your chart, you can stay informed about changes in interest rates and their potential impact on other markets.
リリースノート
1. What Is the US 20-Year Treasury Yield?The US 20-Year Treasury Yield is a financial metric that shows the interest rate (or yield) investors earn when they buy US government bonds that mature in 20 years. It’s an important indicator of the economy and can influence other markets like stocks, bonds, and currencies.
2. How Does the Indicator Work?
The indicator fetches the latest data for the US 20-Year Treasury Yield from TradingView's database.
It then plots this data in a separate pane below your main chart, so you can easily monitor the yield without cluttering your price chart.
3. What Does the Indicator Show?
A blue line is drawn in the separate pane, showing the movement of the US 20-Year Treasury Yield over time.
A gray dashed line is added at the 4.0% level as a reference point. You can use this line to quickly see when the yield is above or below 4.0%.
オープンソーススクリプト
TradingViewの精神に則り、このスクリプトの作者はコードをオープンソースとして公開してくれました。トレーダーが内容を確認・検証できるようにという配慮です。作者に拍手を送りましょう!無料で利用できますが、コードの再公開はハウスルールに従う必要があります。
免責事項
この情報および投稿は、TradingViewが提供または推奨する金融、投資、トレード、その他のアドバイスや推奨を意図するものではなく、それらを構成するものでもありません。詳細は利用規約をご覧ください。
オープンソーススクリプト
TradingViewの精神に則り、このスクリプトの作者はコードをオープンソースとして公開してくれました。トレーダーが内容を確認・検証できるようにという配慮です。作者に拍手を送りましょう!無料で利用できますが、コードの再公開はハウスルールに従う必要があります。
免責事項
この情報および投稿は、TradingViewが提供または推奨する金融、投資、トレード、その他のアドバイスや推奨を意図するものではなく、それらを構成するものでもありません。詳細は利用規約をご覧ください。