OPEN-SOURCE SCRIPT
更新済 Thamer's ALL IN ONE RSI

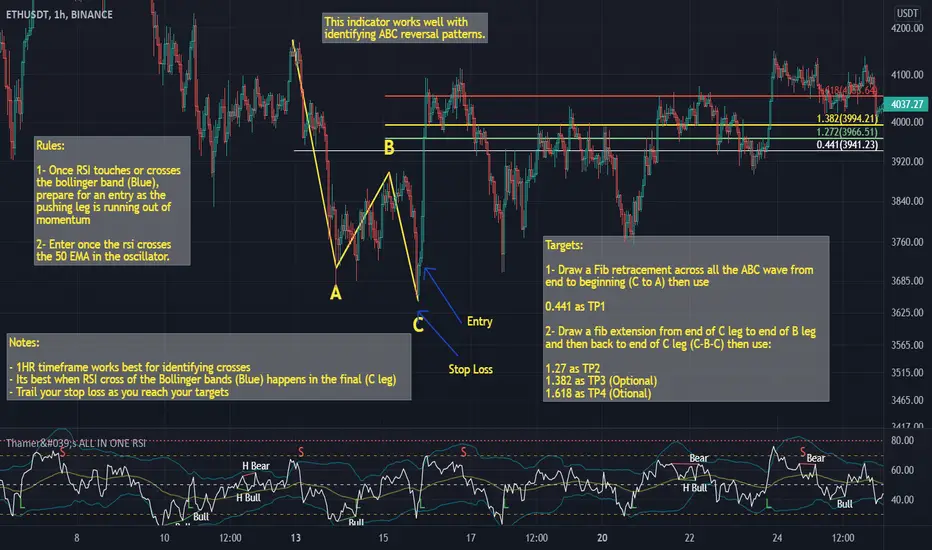
This is a special relative strength index indicator that includes the following:
- Bollinger Bands on the RSI
- EMA on the RSI
- SMA on the RSI
You can use the Bollinger bands on the RSI to identify extreme volatility and momentum areas based on the RSI
You can also use RSI break out of the EMA or SMA as a confluence of strong momentum.
- Bollinger Bands on the RSI
- EMA on the RSI
- SMA on the RSI
You can use the Bollinger bands on the RSI to identify extreme volatility and momentum areas based on the RSI
You can also use RSI break out of the EMA or SMA as a confluence of strong momentum.
リリースノート
UPDATES:- Look at the chart for more info on how to use the indicator for a momentum confluence and confirmation
- Base line of the Bollinger band is now based on EMA instead of SMA
リリースノート
ALL IN ONE RSI is an indicator that i created to be used in trading the ABC patterns. i was inspired in creating this indicator by the famous TDI indicator. although at first you may think they are the same but when you open both of them you can easily spot the differences.This special relative strength index indicator includes the following:
- Bollinger Bands on the RSI
- Momentum Moving Average
- RSI Divergence Auto detector
You can use the Bollinger bands on the RSI to identify extreme volatility and momentum areas based on the RSI
You can also use RSI break out of the Momentum moving average as a confluence of strong momentum.
The New update released on 01.01.2022 includes:
- Divergence Auto detection.
リリースノート
In this update:- Entries of possible Longs and Shorts are now plotted in the indicator to be easily seen
- Mid line is back after i removed it by mistake in the previous update
- Divergences labels are made simpler now by default so your indicator is not congested with so many things to look at
Note: the possible longs and shorts entries do repaint, so they are confirmed by candle close of the timeframe you are on. keep that in mind
Stay Tuned for the next update for more things to include
リリースノート
Chart editedリリースノート
in this Update:- you now have the alerts of the Long or Short entries working perfectly.
Note: i would suggest when setting up the alert to set per bar close for confirmation and preventing repainting signals
オープンソーススクリプト
TradingViewの精神に則り、この作者はスクリプトのソースコードを公開しているので、その内容を理解し検証することができます。作者に感謝です!無料でお使いいただけますが、このコードを投稿に再利用する際にはハウスルールに従うものとします。
免責事項
これらの情報および投稿は、TradingViewが提供または保証する金融、投資、取引、またはその他の種類のアドバイスや推奨を意図したものではなく、またそのようなものでもありません。詳しくは利用規約をご覧ください。
オープンソーススクリプト
TradingViewの精神に則り、この作者はスクリプトのソースコードを公開しているので、その内容を理解し検証することができます。作者に感謝です!無料でお使いいただけますが、このコードを投稿に再利用する際にはハウスルールに従うものとします。
免責事項
これらの情報および投稿は、TradingViewが提供または保証する金融、投資、取引、またはその他の種類のアドバイスや推奨を意図したものではなく、またそのようなものでもありません。詳しくは利用規約をご覧ください。