OPEN-SOURCE SCRIPT
DXY Z-Score
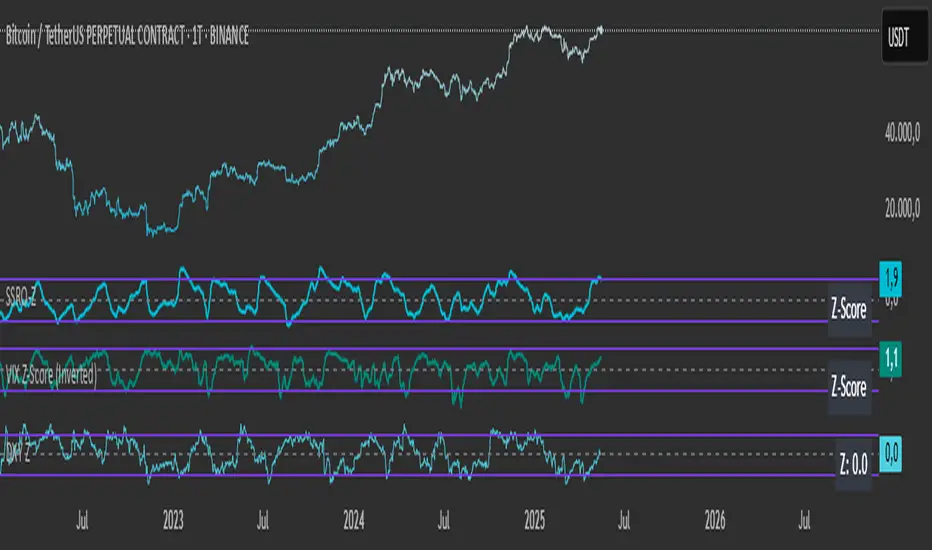
The "DXY Z-Score" indicator measures the US Dollar Index’s (DXY) current price relative to its recent average, normalized by its standard deviation.
It calculates a standardized Z-Score that oscillates around zero, highlighting when the DXY is significantly overbought or oversold.
Key features include:
- The Z-Score line oscillating between fixed upper (+2) and lower (-2) horizontal levels
- A shaded background to emphasize the Z-Score range between these bands
- A dynamic table showing the current Z-Score value linked linearly to the Z-Score plot
This indicator is useful for assessing the strength or weakness of the US Dollar relative to its recent history, providing insights into potential market reversals or trend continuations.
オープンソーススクリプト
TradingViewの精神に則り、このスクリプトの作者はコードをオープンソースとして公開してくれました。トレーダーが内容を確認・検証できるようにという配慮です。作者に拍手を送りましょう!無料で利用できますが、コードの再公開はハウスルールに従う必要があります。
免責事項
この情報および投稿は、TradingViewが提供または推奨する金融、投資、トレード、その他のアドバイスや推奨を意図するものではなく、それらを構成するものでもありません。詳細は利用規約をご覧ください。
オープンソーススクリプト
TradingViewの精神に則り、このスクリプトの作者はコードをオープンソースとして公開してくれました。トレーダーが内容を確認・検証できるようにという配慮です。作者に拍手を送りましょう!無料で利用できますが、コードの再公開はハウスルールに従う必要があります。
免責事項
この情報および投稿は、TradingViewが提供または推奨する金融、投資、トレード、その他のアドバイスや推奨を意図するものではなく、それらを構成するものでもありません。詳細は利用規約をご覧ください。