OPEN-SOURCE SCRIPT
更新済 FACTOR MONITOR
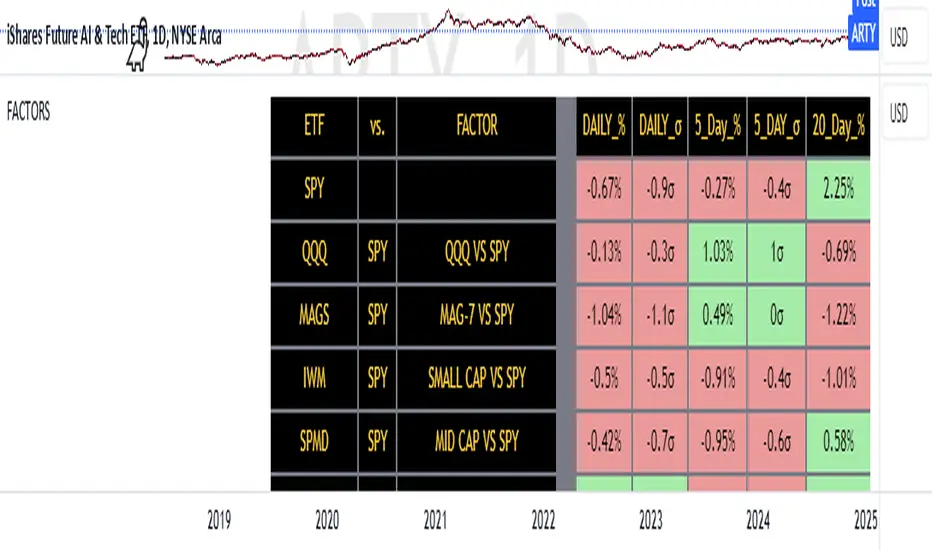
The Factor Monitor is a comprehensive designed to track relative strength and standard deviation movements across multiple market segments and investment factors. The indicator calculates and displays normalized percentage moves and their statistical significance (measured in standard deviations) across daily, 5-day, and 20-day periods, providing a multi-timeframe view of market dynamics.
Key Features:
Real-time tracking of relative performance between various ETF pairs (e.g., QQQ vs SPY, IWM vs SPY)
Standard deviation scoring system that identifies statistically significant moves
Color-coded visualization (green/red) for quick interpretation of relative strength
Multiple timeframe analysis (1-day, 5-day, and 20-day moves)
Monitoring of key market segments:
Style factors (Value, Growth, Momentum)
Market cap segments (Large, Mid, Small)
Sector relative strength
Risk factors (High Beta vs Low Volatility)
Credit conditions (High Yield vs Investment Grade)
The tool is particularly valuable for:
Identifying significant factor rotations in the market
Assessing market breadth through relative strength comparisons
Spotting potential trend changes through statistical deviation analysis
Monitoring sector leadership and market regime shifts
Quantifying the magnitude of market moves relative to historical norms
リリースノート
Just changed colors around to make more readableリリースノート
Updated MAGS exchangeオープンソーススクリプト
TradingViewの精神に則り、このスクリプトの作者はコードをオープンソースとして公開してくれました。トレーダーが内容を確認・検証できるようにという配慮です。作者に拍手を送りましょう!無料で利用できますが、コードの再公開はハウスルールに従う必要があります。
免責事項
この情報および投稿は、TradingViewが提供または推奨する金融、投資、トレード、その他のアドバイスや推奨を意図するものではなく、それらを構成するものでもありません。詳細は利用規約をご覧ください。
オープンソーススクリプト
TradingViewの精神に則り、このスクリプトの作者はコードをオープンソースとして公開してくれました。トレーダーが内容を確認・検証できるようにという配慮です。作者に拍手を送りましょう!無料で利用できますが、コードの再公開はハウスルールに従う必要があります。
免責事項
この情報および投稿は、TradingViewが提供または推奨する金融、投資、トレード、その他のアドバイスや推奨を意図するものではなく、それらを構成するものでもありません。詳細は利用規約をご覧ください。