OPEN-SOURCE SCRIPT
Average True Range % of Price
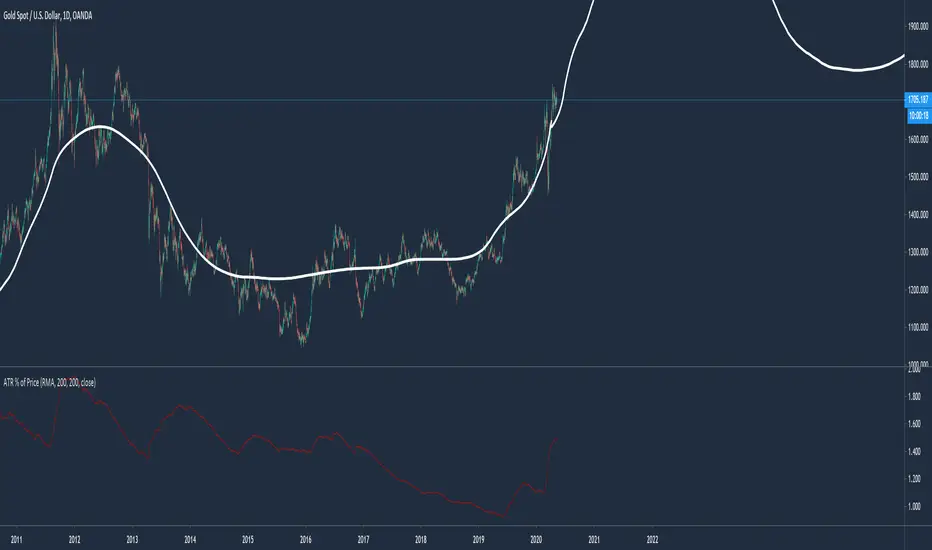
This script easily shows in an indicator window the Average True Range % of Price, which helps people understand the volatility of an asset in % terms defined by custom MA periods for custom ATR periods.
The MA Period gives the average price.
The ATR Period gives the average range.
The Average Range / Average Price = Average Range % of Price.
Understanding the volatility of an asset can help people manage risk e.g. if an asset has a low entry cost, but very high volatility it may be more risky than another asset with a high entry cost, but much lower volatility.
オープンソーススクリプト
TradingViewの精神に則り、このスクリプトの作者はコードをオープンソースとして公開してくれました。トレーダーが内容を確認・検証できるようにという配慮です。作者に拍手を送りましょう!無料で利用できますが、コードの再公開はハウスルールに従う必要があります。
免責事項
この情報および投稿は、TradingViewが提供または推奨する金融、投資、トレード、その他のアドバイスや推奨を意図するものではなく、それらを構成するものでもありません。詳細は利用規約をご覧ください。
オープンソーススクリプト
TradingViewの精神に則り、このスクリプトの作者はコードをオープンソースとして公開してくれました。トレーダーが内容を確認・検証できるようにという配慮です。作者に拍手を送りましょう!無料で利用できますが、コードの再公開はハウスルールに従う必要があります。
免責事項
この情報および投稿は、TradingViewが提供または推奨する金融、投資、トレード、その他のアドバイスや推奨を意図するものではなく、それらを構成するものでもありません。詳細は利用規約をご覧ください。