OPEN-SOURCE SCRIPT
Candle Close Location Marker
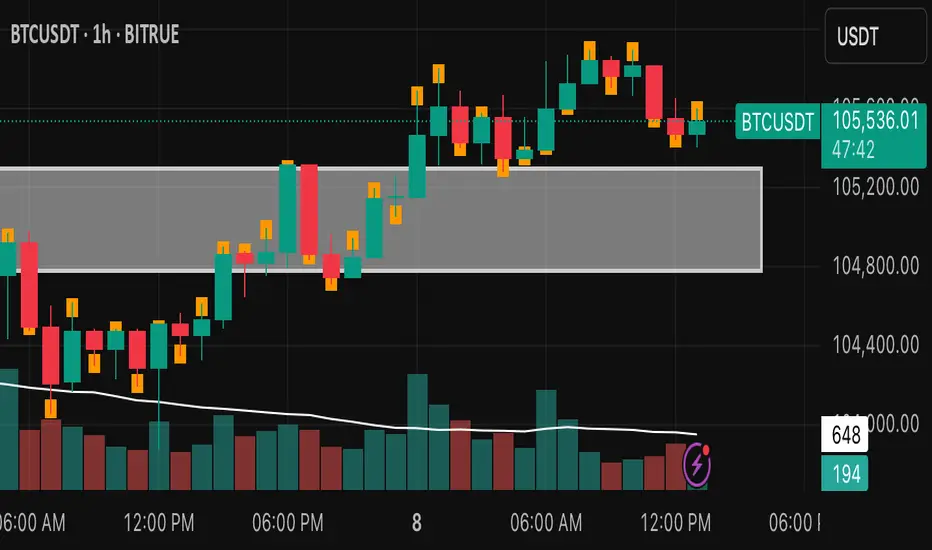
This script customizes the appearance of candlesticks by highlighting whether the candle closed in the upper, middle, or lower part of its range — using a small orange marker inside each candle.
It also includes a traditional volume histogram with two simple moving averages (SMA 20 and SMA 50), helping traders detect volume trends and potential reversals.
📌 Useful for identifying strength of momentum and visualizing market sentiment clearly.
Features:
• ✅ Colored candles: green for bullish, black for bearish
• ✅ Orange square shows the position of the close (top, middle, or bottom of the candle)
• ✅ Volume bars with SMA 20 (orange) and SMA 50 (blue)
• ✅ Works on all timeframes
Developed by: [Your Name or Alias]
Version: 1.0
Language: Pine Script v5
オープンソーススクリプト
TradingViewの精神に則り、このスクリプトの作者はコードをオープンソースとして公開してくれました。トレーダーが内容を確認・検証できるようにという配慮です。作者に拍手を送りましょう!無料で利用できますが、コードの再公開はハウスルールに従う必要があります。
免責事項
この情報および投稿は、TradingViewが提供または推奨する金融、投資、トレード、その他のアドバイスや推奨を意図するものではなく、それらを構成するものでもありません。詳細は利用規約をご覧ください。
オープンソーススクリプト
TradingViewの精神に則り、このスクリプトの作者はコードをオープンソースとして公開してくれました。トレーダーが内容を確認・検証できるようにという配慮です。作者に拍手を送りましょう!無料で利用できますが、コードの再公開はハウスルールに従う必要があります。
免責事項
この情報および投稿は、TradingViewが提供または推奨する金融、投資、トレード、その他のアドバイスや推奨を意図するものではなく、それらを構成するものでもありません。詳細は利用規約をご覧ください。