OPEN-SOURCE SCRIPT
Multi-EMA System (9,34,50,200)
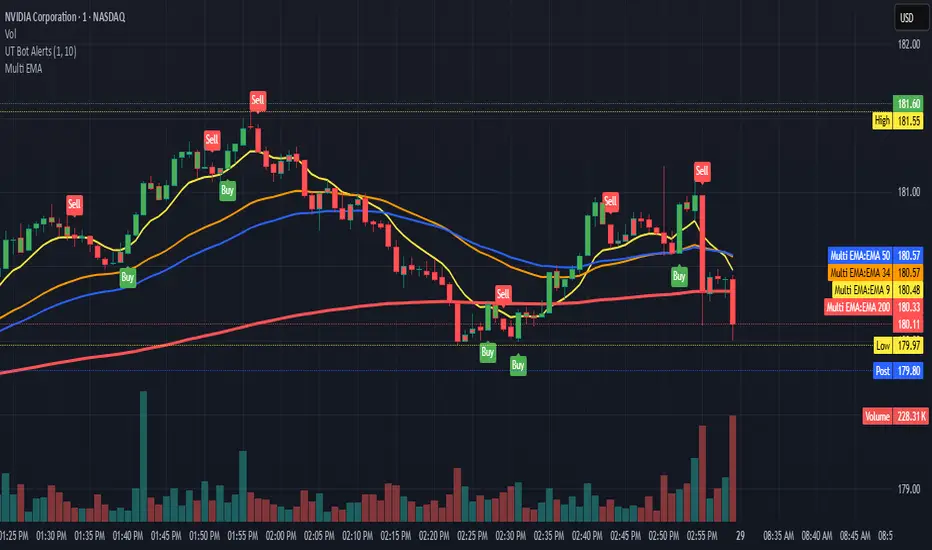
This script gives you:
Yellow line: 9 EMA (your fastest momentum indicator)
Orange line: 34 EMA (good for short-term trend confirmation)
Blue line: 50 EMA (classic medium-term trend line)
Red line: 200 EMA (the big daddy - long-term trend and major support/resistance)
I made the 200 EMA a bit thicker since it's usually the most significant level. You can adjust the colors in the script if you prefer different ones.
オープンソーススクリプト
TradingViewの精神に則り、このスクリプトの作者はコードをオープンソースとして公開してくれました。トレーダーが内容を確認・検証できるようにという配慮です。作者に拍手を送りましょう!無料で利用できますが、コードの再公開はハウスルールに従う必要があります。
免責事項
この情報および投稿は、TradingViewが提供または推奨する金融、投資、トレード、その他のアドバイスや推奨を意図するものではなく、それらを構成するものでもありません。詳細は利用規約をご覧ください。
オープンソーススクリプト
TradingViewの精神に則り、このスクリプトの作者はコードをオープンソースとして公開してくれました。トレーダーが内容を確認・検証できるようにという配慮です。作者に拍手を送りましょう!無料で利用できますが、コードの再公開はハウスルールに従う必要があります。
免責事項
この情報および投稿は、TradingViewが提供または推奨する金融、投資、トレード、その他のアドバイスや推奨を意図するものではなく、それらを構成するものでもありません。詳細は利用規約をご覧ください。