OPEN-SOURCE SCRIPT
更新済 RSI & Volume Coloured Bars
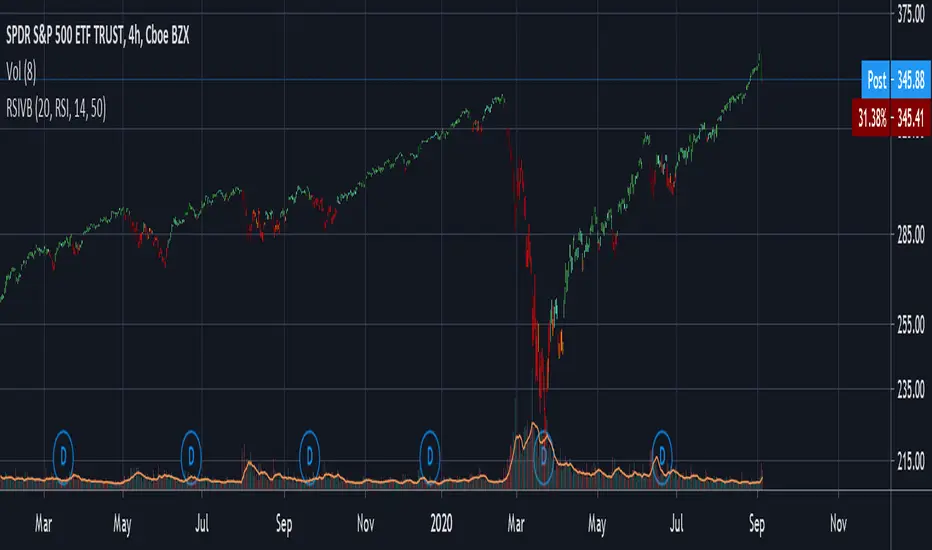
Candles get darker when volume is high, and brighter when volume is low. They are red or green depending on whether the RSI is above or below a threshold value, or alternatively you can pick a more vanilla coloring based on current close vs last close or last open.
For personal use as I enjoy the aesthetics of it. The more solid RSI coloring helps highlight the brightness variations from changing volume and makes trends crystal clear.
Inspired by "Volume Based Coloured Bars" by KivancOzbilgic:

and by and by RSI bars chart by taskman9:
tradingview.com/v/TSZVxrAE/
For personal use as I enjoy the aesthetics of it. The more solid RSI coloring helps highlight the brightness variations from changing volume and makes trends crystal clear.
Inspired by "Volume Based Coloured Bars" by KivancOzbilgic:
and by and by RSI bars chart by taskman9:
tradingview.com/v/TSZVxrAE/
リリースノート
Added an "invert" checkbox that lets you invert red/green should you want to.オープンソーススクリプト
TradingViewの精神に則り、このスクリプトの作者はコードをオープンソースとして公開してくれました。トレーダーが内容を確認・検証できるようにという配慮です。作者に拍手を送りましょう!無料で利用できますが、コードの再公開はハウスルールに従う必要があります。
免責事項
この情報および投稿は、TradingViewが提供または推奨する金融、投資、トレード、その他のアドバイスや推奨を意図するものではなく、それらを構成するものでもありません。詳細は利用規約をご覧ください。
オープンソーススクリプト
TradingViewの精神に則り、このスクリプトの作者はコードをオープンソースとして公開してくれました。トレーダーが内容を確認・検証できるようにという配慮です。作者に拍手を送りましょう!無料で利用できますが、コードの再公開はハウスルールに従う必要があります。
免責事項
この情報および投稿は、TradingViewが提供または推奨する金融、投資、トレード、その他のアドバイスや推奨を意図するものではなく、それらを構成するものでもありません。詳細は利用規約をご覧ください。