OPEN-SOURCE SCRIPT
Normalized Volume
OVERVIEW
The Normalized Volume indicator is a technical indicator that gauges the amount of volume currently present in the market, relative to the average volume in the market. The purpose of this indicator is to filter out with-trend signals during ranging/non-trending/consolidating conditions.
CONCEPTS
This indicator assists traders in capitalizing on the assumption that trends are more likely to start during periods of high volume compared to periods of low volume. This is because high volume indicates that there are bigger players currently in the market, which is necessary to begin a sustained trending move.
So, to determine whether the current volume is "high", it is compared to an average volume for however number of candles back the user specifies.
If the current volume is greater than the average volume, it is reasonable to assume we are in a high-volume period. Thus, this is the ideal time to enter a trending trade due to the assumption that trends are more likely to start during these high-volume periods.
More information on this indicator can be found on NNFX's video on it in his Indicator Profile series and on Stonehill Forex's blog post on it.
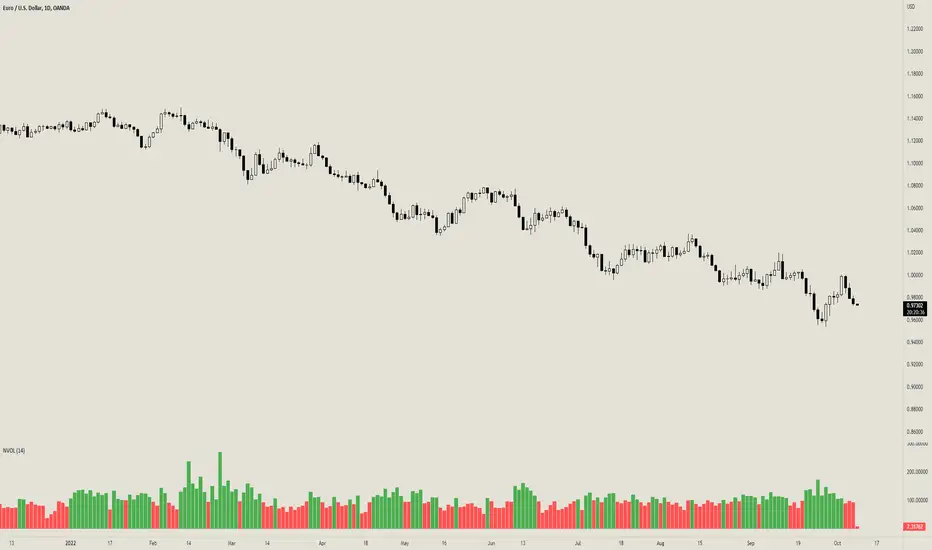
HOW DO I READ THIS INDICATOR
When the column's color is red, don't take any trend trades since the current volume is less than the average volume experienced in the market.
When the column's color is green, take all valid with-trend trades since the current volume is greater than the average volume experienced in the market.
The Normalized Volume indicator is a technical indicator that gauges the amount of volume currently present in the market, relative to the average volume in the market. The purpose of this indicator is to filter out with-trend signals during ranging/non-trending/consolidating conditions.
CONCEPTS
This indicator assists traders in capitalizing on the assumption that trends are more likely to start during periods of high volume compared to periods of low volume. This is because high volume indicates that there are bigger players currently in the market, which is necessary to begin a sustained trending move.
So, to determine whether the current volume is "high", it is compared to an average volume for however number of candles back the user specifies.
If the current volume is greater than the average volume, it is reasonable to assume we are in a high-volume period. Thus, this is the ideal time to enter a trending trade due to the assumption that trends are more likely to start during these high-volume periods.
More information on this indicator can be found on NNFX's video on it in his Indicator Profile series and on Stonehill Forex's blog post on it.
HOW DO I READ THIS INDICATOR
When the column's color is red, don't take any trend trades since the current volume is less than the average volume experienced in the market.
When the column's color is green, take all valid with-trend trades since the current volume is greater than the average volume experienced in the market.
オープンソーススクリプト
TradingViewの精神に則り、このスクリプトの作者はコードをオープンソースとして公開してくれました。トレーダーが内容を確認・検証できるようにという配慮です。作者に拍手を送りましょう!無料で利用できますが、コードの再公開はハウスルールに従う必要があります。
免責事項
この情報および投稿は、TradingViewが提供または推奨する金融、投資、トレード、その他のアドバイスや推奨を意図するものではなく、それらを構成するものでもありません。詳細は利用規約をご覧ください。
オープンソーススクリプト
TradingViewの精神に則り、このスクリプトの作者はコードをオープンソースとして公開してくれました。トレーダーが内容を確認・検証できるようにという配慮です。作者に拍手を送りましょう!無料で利用できますが、コードの再公開はハウスルールに従う必要があります。
免責事項
この情報および投稿は、TradingViewが提供または推奨する金融、投資、トレード、その他のアドバイスや推奨を意図するものではなく、それらを構成するものでもありません。詳細は利用規約をご覧ください。