OPEN-SOURCE SCRIPT
Early Relative Volume
"Buy or Sell when you see a spike in volume" is advice that you often hear, the problem for me was that you only find out that volume is spiking after the fact. So that's why I created the Early Relative Volume indicator.
The Early Relative Volume indicator takes the amount of time that has passed for the current bar, let's say 10 seconds, and compares the volume of that first 10 seconds to the average volume in 10 seconds of the previous candle.
That means that it will tell you if the volume thus far in the current candle is more or less than the relative volume of the previous candle, so that you can potentially get an indication that the volume of the current candle is going to be greater or less than the previous candle.
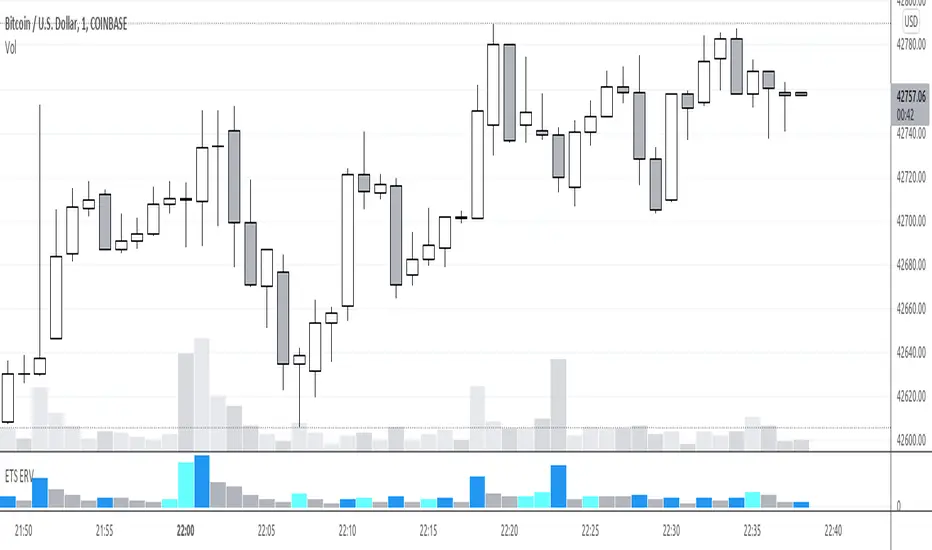
This approach is of course not perfect, and obviously the values update as the current candle progresses, but I've found it useful to identify early breakout candles.
There is also an option to do the same calculation with the size of the body of the candle, by enabling the "Blue bars if candle body and volume bigger" option. It will only turn blue of both the volume and the size of the candle's body is calculated to be bigger.
I hope this helps you in your trading!
The Early Relative Volume indicator takes the amount of time that has passed for the current bar, let's say 10 seconds, and compares the volume of that first 10 seconds to the average volume in 10 seconds of the previous candle.
That means that it will tell you if the volume thus far in the current candle is more or less than the relative volume of the previous candle, so that you can potentially get an indication that the volume of the current candle is going to be greater or less than the previous candle.
This approach is of course not perfect, and obviously the values update as the current candle progresses, but I've found it useful to identify early breakout candles.
There is also an option to do the same calculation with the size of the body of the candle, by enabling the "Blue bars if candle body and volume bigger" option. It will only turn blue of both the volume and the size of the candle's body is calculated to be bigger.
I hope this helps you in your trading!
オープンソーススクリプト
TradingViewの精神に則り、このスクリプトの作者はコードをオープンソースとして公開してくれました。トレーダーが内容を確認・検証できるようにという配慮です。作者に拍手を送りましょう!無料で利用できますが、コードの再公開はハウスルールに従う必要があります。
Doing what I can to help people trade better. Past performance doesn't guarantee future results. Trade at your own risk. This is not financial advice, it is personal opinion, I'm not a financial adviser. I may have a stake in what I write about.
免責事項
この情報および投稿は、TradingViewが提供または推奨する金融、投資、トレード、その他のアドバイスや推奨を意図するものではなく、それらを構成するものでもありません。詳細は利用規約をご覧ください。