OPEN-SOURCE SCRIPT
Auto Trend Channel with Fibonacci
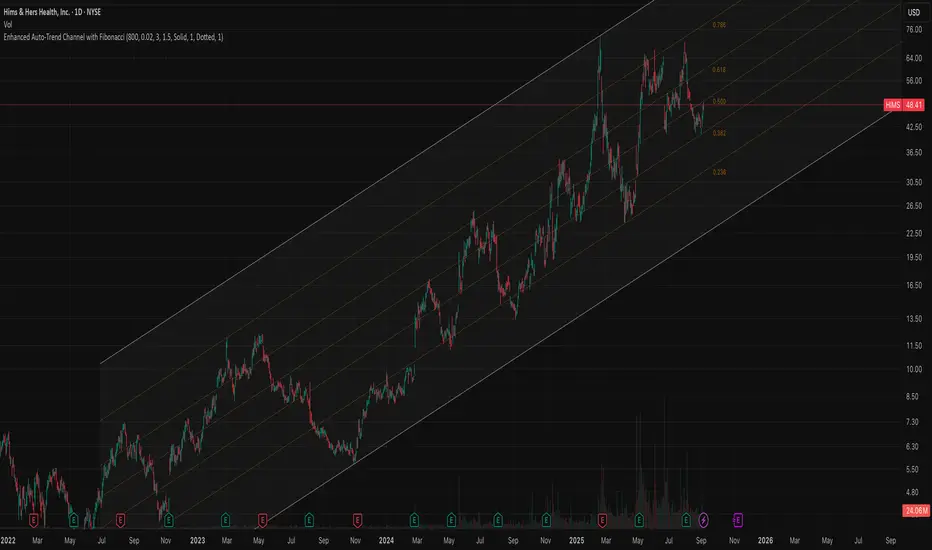
‼️ PLEASE USE WITH LOG CHART
🟠 Overview
This indicator introduces a novel approach to trend channel construction by implementing a touch-based validation system that ensures channels actually function as dynamic support and resistance levels. Unlike traditional linear regression channels that simply fit a mathematical line through price data, this indicator validates channel effectiveness by measuring how frequently price interacts with the boundaries, creating channels that traders can reliably use for entry and exit decisions.
🟠 Core Idea: Touch-Based Channel Validation
The fundamental problem with standard regression channels is that they often create mathematically correct but practically useless boundaries that price rarely respects. This indicator solves this by introducing a dual-scoring optimization system that evaluates each potential channel based on two critical factors:
Trend Correlation (70% weight): Measures how well prices follow the overall trend direction using Pearson correlation coefficient
Boundary Touch Frequency (30% weight): Counts actual instances where price highs touch the upper channel and lows touch the lower channel
This combination ensures the selected channel not only follows the trend but actively serves as support and resistance.
🟠 Trading Applications
Trend Following
Strong Uptrend: Price consistently bounces off lower channel and Fibonacci levels
Strong Downtrend: Price repeatedly fails at upper channel and Fibonacci resistance
Trend Weakening: Price fails to reach channel extremes or breaks through
Entry Strategies
Channel Bounce Entries: Enter long when price touches lower channel with confirmation; short at upper channel touches
Fibonacci Retracement Entries: Use 38.2% or 61.8% levels for pullback entries in trending markets
Breakout Entries: Trade breakouts when price closes beyond channels with increased volume
🟠 Customization Parameters
Automatic/Manual Period: Choose between intelligent auto-detection or fixed lookback period
Touch Sensitivity (0.1%-10%): Defines how close price must be to count as a boundary touch
Minimum Touches (1-10): Filter threshold for channel validation
Adaptive Deviation: Toggle between calculated or manual deviation multipliers
オープンソーススクリプト
TradingViewの精神に則り、このスクリプトの作者はコードをオープンソースとして公開してくれました。トレーダーが内容を確認・検証できるようにという配慮です。作者に拍手を送りましょう!無料で利用できますが、コードの再公開はハウスルールに従う必要があります。
免責事項
この情報および投稿は、TradingViewが提供または推奨する金融、投資、トレード、その他のアドバイスや推奨を意図するものではなく、それらを構成するものでもありません。詳細は利用規約をご覧ください。
オープンソーススクリプト
TradingViewの精神に則り、このスクリプトの作者はコードをオープンソースとして公開してくれました。トレーダーが内容を確認・検証できるようにという配慮です。作者に拍手を送りましょう!無料で利用できますが、コードの再公開はハウスルールに従う必要があります。
免責事項
この情報および投稿は、TradingViewが提供または推奨する金融、投資、トレード、その他のアドバイスや推奨を意図するものではなく、それらを構成するものでもありません。詳細は利用規約をご覧ください。